
. 2019 Apr 11;10(2):89–97. doi: 10.14740/cr839
Copyright 2019, Clua-Espuny et al.
This article is distributed under the terms of the Creative Commons Attribution Non-Commercial 4.0 International License, which permits unrestricted non-commercial use, distribution, and reproduction in any medium, provided the original work is properly cited.
Figure 6.
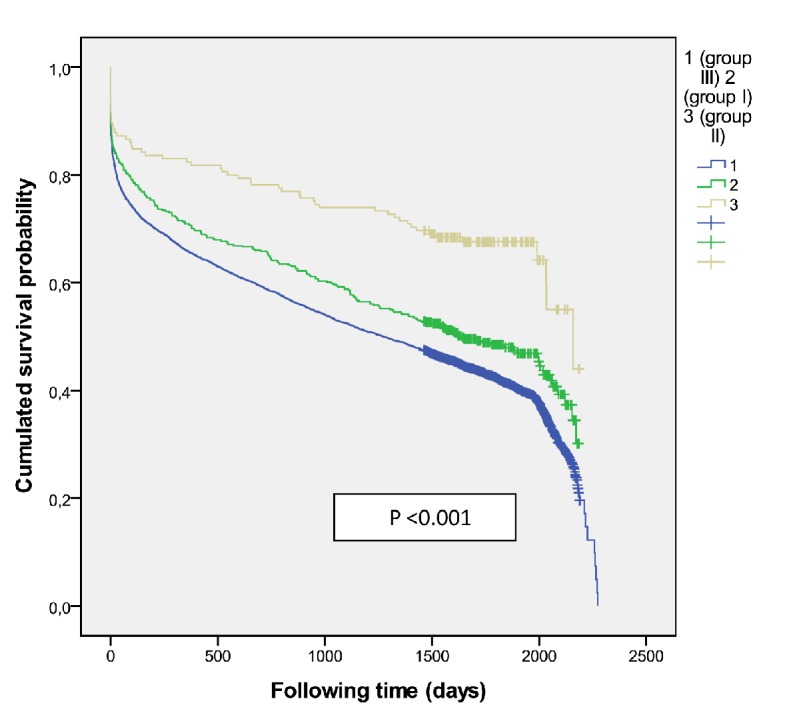
Overall mortality according treatment group in women.