FIG 10.
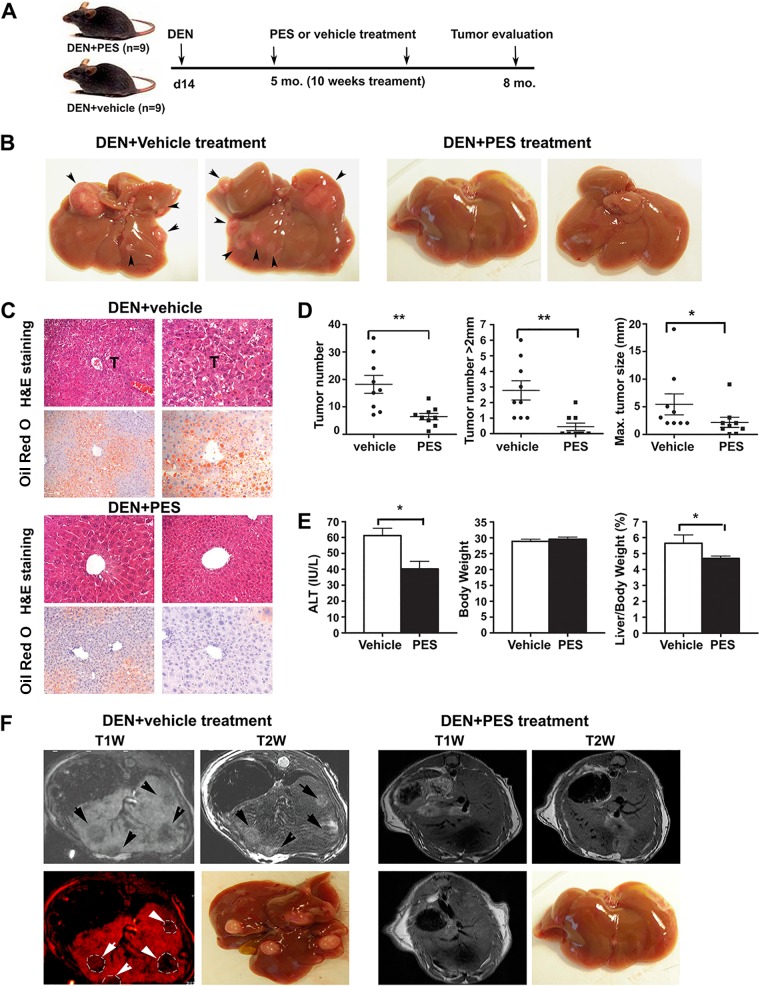
Modulation of HSP70 function by PES attenuates carcinogen-induced HCC progression. (A) Schematics of the treatment protocol. A cohort of 18 WT male mice were injected with DEN at P14. Five months later, cohorts of mice were treated either with vehicle (DMSO) or with PES once a week for 10 weeks. At 8 months of age, the hepatic phenotype of the mice was examined by measuring tumor burdens using MRI and macroscopic inspection of livers, as well as by histological examination of liver sections. (B) Representative macroscopic photographs of livers from WT mice treated with PES or vehicle. Arrowheads indicate multiple tumor nodules in vehicle-treated mice, but there are no visible tumors in PES-treated animals. (C) Representative histological analysis (H&E) of livers, showing tumor (T) areas in vehicle-treated mice (upper panels). Oil Red O staining of representative sections shows extensive hepatic steatosis in vehicle-treated group but reduced or absent fat accumulation in the livers of PES-treated mice (lower panels). Original magnification, ×200. (D) Quantification of liver tumors in PES (n = 9 mice)- or vehicle (n = 9 mice)-treated mice. Bars represent mean ± SD. Statistical significance is indicated (*, P < 0.05; **, P < 0.01). (E) Tumor regression in PES-treated mice was associated with substantial amelioration of hepatic injury assessed by the serum ALT level and decreased ratio of liver to body weight. Bars are mean ± SD (n = 9 mice per group). (F) Representative MRI images, with liver tumors readily visible in vehicle-treated mice but significantly reduced tumor size or even an effective therapeutic response in PES-treated animals. Upper row, T1W and T2W images of liver, showing hypointense (T1W) and hyperintense (T2W) regions of tumors in vehicle-treated mice (left two panels) and no tumors in PES-treated mice (right panels). Lower row, T1W image, enhanced with pseudocolor, from a vehicle-treated mouse showing multiple tumors (left panel) and representative images from vehicle-treated and PES-treated animals; no tumors are visible in the PES-treated animal (compare second and fourth panels from left). Resolution of images: T1W, 200 by 200 by 500 μm; T2W, 100 by 100 by 500 μm. Tumor nodules are indicated (arrowheads).

