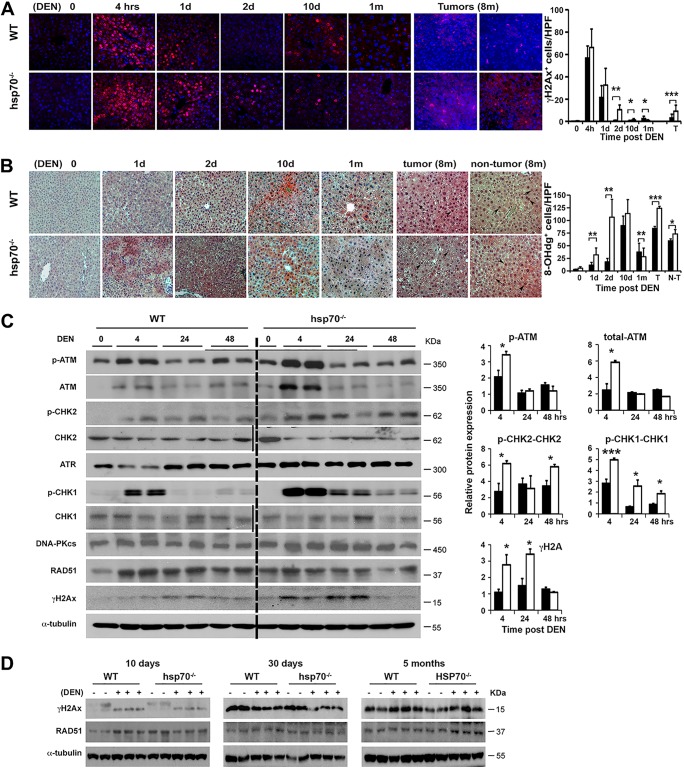
FIG 5.
HSP70 loss enhances and prolongs the DNA damage response and checkpoint activation. (A) IF staining of γH2AX in liver sections from WT and hsp70−/− mice at the indicated time points after DEN injection at P14. Red labels, γH2AX-positive cells; blue labels, DAPI-labeled nuclei of the same field. Original magnification, ×200. The graph shows quantification of γH2AX+ cells per high-power field (HPF) (right panel). Bars show mean ± SEM (n = 3 mice per group). (B) The extent of ROS-induced DNA damage in liver sections from WT and hsp70−/− mice was analyzed by IHC staining for 8-OHdG (red labels). Representative images at the indicated times points after DEN injection at P14 are presented, and the graph shows quantification of 8-OHdG-positive cells per HPF (right panel). Data are shown as mean ± SEM (n = 5 mice per group). (C) Representative WB of DDR and checkpoint proteins in the livers of WT and hsp70−/− mice at the indicated time points after DEN injection at P14. The level of phosphorylated proteins normalized to the total level was expressed as relative fold increase with respect to the control (WT without DEN, indicated as 0), which was arbitrarily set at 1. Notably, no statistical difference in protein levels of ATR, DNA-PKcs, and RAD51 normalized to total protein (loading control) was detected between the genotypes. Bars show mean ± SEM (n = 5 mice per group). (D) WB analysis of DNA damage markers γH2AX and RAD51 in the livers of WT and hsp70−/− mice treated with DEN at P14 and assayed at the indicated times (from two experiments). For all panels, statistical significance is indicated (*, P < 0.05; **, P < 0.01; ***, P < 0.001). Bars indicate WT (filled) or hsp70−/− (open) mice.

