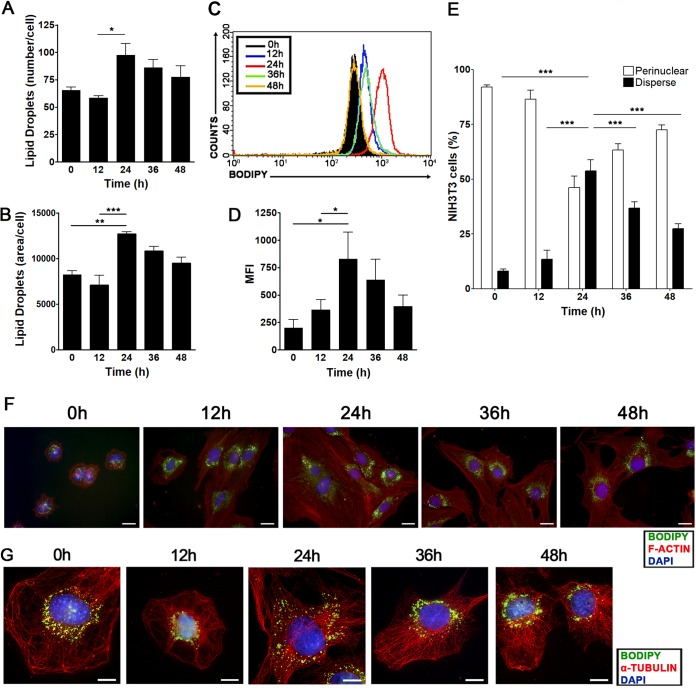
FIG 2.
The quantity and subcellular localization of lipid droplets vary during cell cycle progression starting from G0/G1-phase-synchronized NIH 3T3 cells. NIH 3T3 cells were synchronized by confluence and serum starvation as shown in Fig. 1A and were then replated at a low density and supplemented with a medium containing 10% FBS. (A and B) Lipid droplet quantification through Oil Red O staining. NIH 3T3 cells were fixed on coverslips and were stained with the fluorescent dye Oil Red O at the indicated time points. The number (A) and total area (arbitrary units) (B) of lipid droplets per cell are shown as means ± standard deviations from three independent experiments. Asterisks indicate significant differences in values (*, P < 0.05; **, P < 0.01; ***, P < 0.001). (C and D) Lipid droplet quantification through flow cytometry. NIH 3T3 cells were stained with Bodipy at the indicated time points and were analyzed by flow cytometry. Data are shown in a fluorescence intensity overlay graph (C) or are expressed as the mean fluorescence emission intensity (MFI) (D). (E to G) Subcellular localization of lipid droplets. NIH 3T3 cells were fixed on coverslips at the indicated time points and were treated with a polyclonal anti-α-tubulin antibody for the detection of microtubules or with phalloidin for F-actin visualization (red), with the hydrophobic fluorescent probe Bodipy for lipid droplet staining (green), and with DAPI for nuclear staining (blue). (E) Graph showing the percentage of NIH 3T3 cells displaying perinuclear or dispersed lipid droplets at the indicated time points. Data in bar graphs are means; error bars, standard deviations. (F and G) Fluorescence microscopy analyses show cellular morphology and the subcellular localization of lipid droplets at the indicated time points. Representative images were captured at objective magnifications of ×40 (F) and ×100 (G). Bars, 10 μm. All data are representative of the results of at least three independent experiments.

