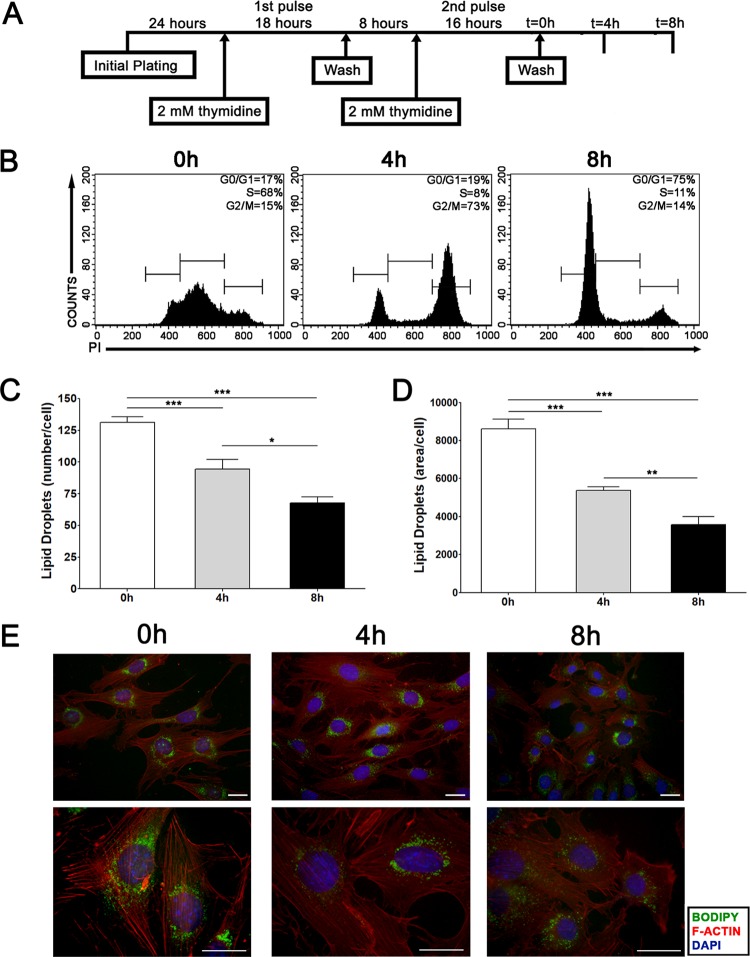
FIG 3.
The quantity and subcellular localization of lipid droplets vary during cell cycle progression starting from S-phase-synchronized NIH 3T3 cells. (A) Experimental scheme of NIH 3T3 cell synchronization by a double thymidine block. (B) Cell cycle analysis was performed by propidium iodide staining of NIH 3T3 cells either before thymidine block release (0 h) or 4 h or 8 h after release. The percentage of cells in each stage of the cell cycle (G0/G1, S, and G2/M) is given. (C and D) Lipid droplet quantification through Oil Red O staining. NIH 3T3 cells were fixed on coverslips and were stained with the fluorescent dye Oil Red O at the indicated time points. The number of lipid droplets (C) and their total area per cell (arbitrary units) (D) are shown. Bars represent means from three independent experiments; error bars, standard deviations. Asterisks indicate significant differences in values (*, P < 0.05; **, P < 0.01; ***, P < 0.001). (E) Subcellular localization of lipid droplets. NIH 3T3 cells were fixed on coverslips at the indicated time points and were treated with phalloidin for F-actin visualization (red), with the hydrophobic fluorescent probe Bodipy for lipid droplet staining (green), and with DAPI for nuclear staining (blue). Fluorescence microscopy analysis shows cellular morphology and the subcellular localization of lipid droplets at the indicated time points. Representative images were captured at objective magnifications of ×40 (top) and ×100 (bottom). Bars, 10 μm. All data are representative of the results of at least three independent experiments.

