FIG 6.
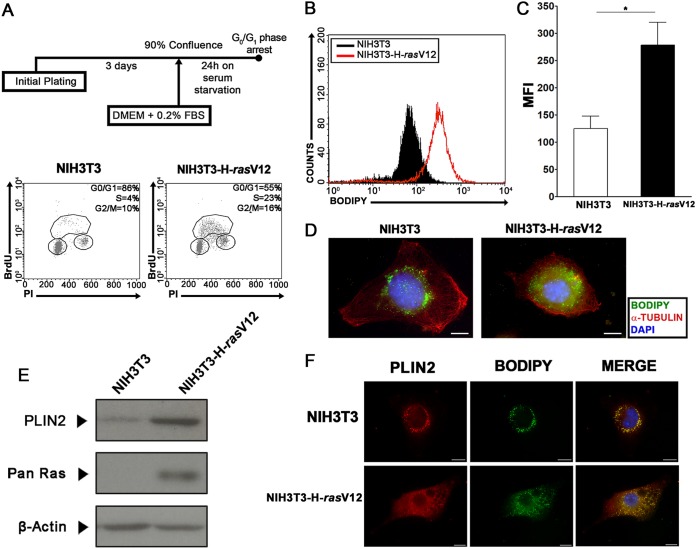
Transformed cells display accumulation of the lipid droplet structural protein PLIN2 and increased numbers of lipid droplets. (A) Experimental scheme of synchronization of NIH 3T3 and NIH 3T3-H-rasV12 cells. Following a confluence and serum starvation procedure (top), cell cycle analysis was performed on NIH 3T3 (bottom left) or NIH 3T3-H-rasV12 (bottom right) cells, and the percentage of cells in each stage of the cell cycle (G0/G1, S, and G2/M) is shown. (B and C) Lipid droplet quantification through flow cytometry. NIH 3T3 or NIH 3T3-H-rasV12 cells were stained with Bodipy after the confluence and serum starvation procedure and were then analyzed by flow cytometry. Data are shown in a fluorescence intensity overlay graph (B) or are expressed as mean fluorescence emission intensity (MFI) (C). Bars indicate means; error bars, standard deviations. An asterisk indicates a significant difference in values (*, P < 0.05). (D) NIH 3T3 cells or NIH 3T3-H-rasV12 cells were fixed on coverslips after confluence and serum starvation and were then treated with a polyclonal anti-α-tubulin antibody for the detection of microtubules (red), with the hydrophobic fluorescent probe Bodipy for lipid droplet staining (green), and with DAPI for nuclear staining (blue). Fluorescence microscopy analysis shows cellular morphology and the accumulation of lipid droplets in NIH 3T3 or NIH 3T3-H-rasV12 cells. Bars, 10 μm. (E) PLIN2 accumulation in NIH 3T3 or NIH 3T3-H-rasV12 cells. Western blotting was performed using antibodies to the indicated proteins after the confluence and serum starvation procedure. (F) NIH 3T3 or NIH 3T3-H-rasV12 cells were treated with a polyclonal anti-PLIN2 (red) antibody, with the hydrophobic fluorescent probe Bodipy for lipid droplet staining (green), and with DAPI for nuclear staining (blue). Bars, 10 μm. All data are representative of the results of at least three independent experiments.

