FIG 7.
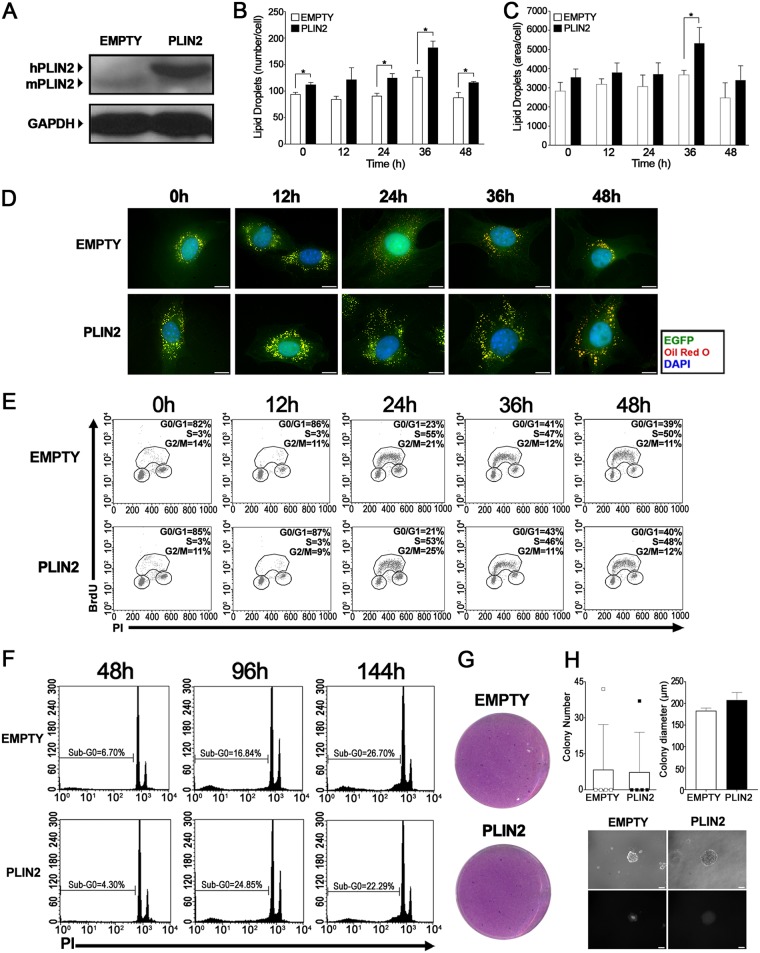
NIH 3T3 cells with PLIN2 overexpression do not show altered cell proliferation or display a transformation phenotype in vitro. (A) PLIN2 accumulation in transduced NIH 3T3 cells. Whole-cell extracts were prepared 24 h after supplementation and replating of synchronized cells transduced with an empty vector or a PLIN2 expression vector. The extracts were later separated by SDS-PAGE. Western blotting was performed using antibodies to the indicated proteins. GAPDH, glyceraldehyde 3-phosphate dehydrogenase. (B and C) Lipid droplet quantification through Oil Red O staining. After supplementation, transduced NIH 3T3 cells were fixed on coverslips and stained with Oil Red O at the indicated time points. The number (B) and total area (arbitrary units) (C) of lipid droplets per cell were determined using ImageQuant TL software (GE Healthcare). Results are means; error bars, standard deviations. An asterisk indicates a significant difference between values (*, P < 0.05). (D) Subcellular localization of lipid droplets. After supplementation, transduced NIH 3T3 cells were fixed on coverslips at the indicated time points and were treated with Oil Red O for lipid droplet staining (red) and with DAPI for nuclear staining (blue). Cell morphology was observed through EGFP fluorescence (green). Fluorescence microscopy analysis shows the subcellular localization of lipid droplets in transduced cells. Bar, 10 μm. (E) Cell cycle progression assay. After synchronization, transduced NIH 3T3 cells were replated at a low density, supplemented with a medium containing 10% FBS, and incubated with 20 μM BrdU for 30 min before fixation at the indicated time points. Later, cell cycle analysis was performed using an FITC-conjugated anti-BrdU antibody together with propidium iodide staining. (F) Cell death assay. After synchronization, transduced NIH 3T3 cells were replated at a low density and were supplemented with a medium containing 0.2% FBS. Sub-G0 DNA content was evaluated with propidium iodide (PI) staining at the times indicated. (G) Focus formation assay. Following transduction, cells were mixed 1:5 with wild-type NIH 3T3 cells. After 12 days, cells were visualized by crystal violet staining. (H) Semisolid-medium growth assay. Following transduction, NIH 3T3 cells were cultured in DMEM containing 0.6% agarose. After 20 days, colonies were counted (top left), and representative colonies were measured (top right) and visualized by both phase-contrast (center) and fluorescence (bottom) microscopy for the detection of EGFP expression. All data are representative of the results of at least three independent experiments.

