. 2019 Apr 17;8:e44964. doi: 10.7554/eLife.44964

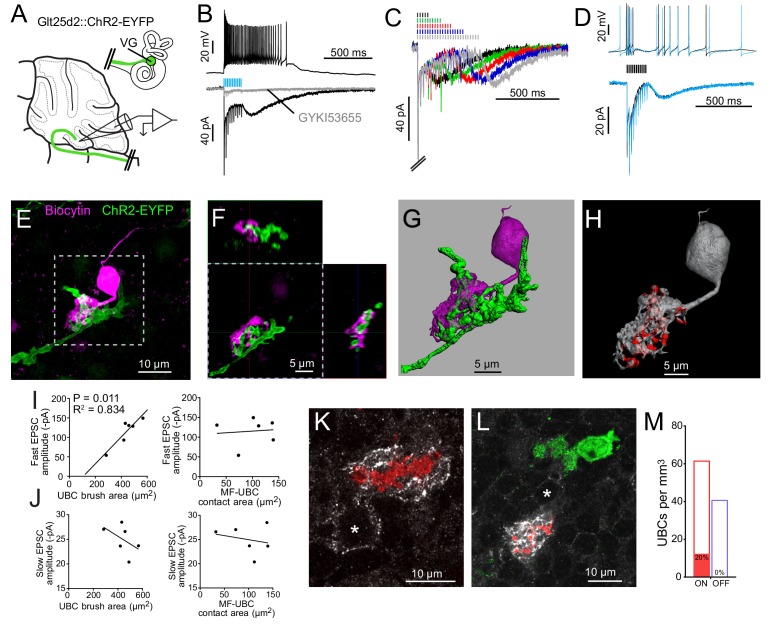
Figure 3. Primary vestibular afferents project to ON UBCs in lobe X.

(A) In the Glt25d2::ChR2-EYFP cross, primary afferents from the vestibular ganglion (VG) expressed ChR2 and were activated by blue light during whole-cell recordings of UBCs in an acute slice preparation. (B) Mossy fibers were activated by LED light pulses (50 Hz 0.25 ms) that evoked spiking responses in postsynaptic UBC that outlasted mossy fiber activation. In the same cell in voltage clamp (below) light pulses evoked fast EPSCs that depressed, followed by a slow inward current. 50 μM GYKI53655 blocked the majority of the inward current. This slow AMPAR-mediated current after the offset of stimulation is diagnostic of an ON UBC. This case was without 4-AP in the bath. All UBCs that had light evoked PSCs were ON UBCs (n = 13). (C) 50 Hz light stimulation of various train durations illustrated as lines above the traces. The slow AMPAR-mediated current begins at the offset of stimulation, consistent with re-activation of AMPARs as they recover from desensitization while glutamate gradually leaves the synapse. (D) Spiking response (top) and EPSCs (bottom) evoked by electrical stimulation (3.8 V, 50 Hz, 0.25 ms, black) were similar to those evoked by ChR2 stimulation (50 Hz 0.25 ms, blue) in the same cell. (E) UBCs were filled with biocytin and recovered in 6/13 cases. This UBC received input from ChR2-EYFP expressing primary vestibular afferent. Maximum intensity projection. (F) Orthogonal view of the boxed region in B, showing UBC brush wrapping around mossy fiber. (G) Surfaces were created on the fluorescence to characterize the structure of the mossy fiber-UBC synapse. (H) A one voxel thick contact layer between the UBC and mossy fiber surfaces was made to calculate the apposition area between the two surfaces (shown in red). The calculated apposition area of this mossy fiber to UBC contact was 137.66 μm2. (I) The postsynaptic EPSC correlated with the area of the UBC brush (left), but did not correlate with the contact area between the mossy fiber and brush (right). Currents are in the presence of 4-AP. (J) The slow EPSC did not correlate with the UBC brush area (left) or contact area between the mossy fiber and brush (right), suggesting that this current is due to the action of glutamate at distant receptors. Currents are in the presence of 4-AP. (K–L) In Glt25d2::tdTomato cross, tdTomato+ primary afferents were seen innervating the brushes of mGluR1+ UBCs (white), but not calretinin+ UBCs (green). Soma of mGluR1+ UBCs identified with *. Single image planes. (M) 20% of counted mGluR1+ UBCs were contacted by tdTomato+ primary afferents. No counted calretinin+ UBCs were contacted by these primary afferents. See also Figure 3—figure supplements 15.

Figure 3.

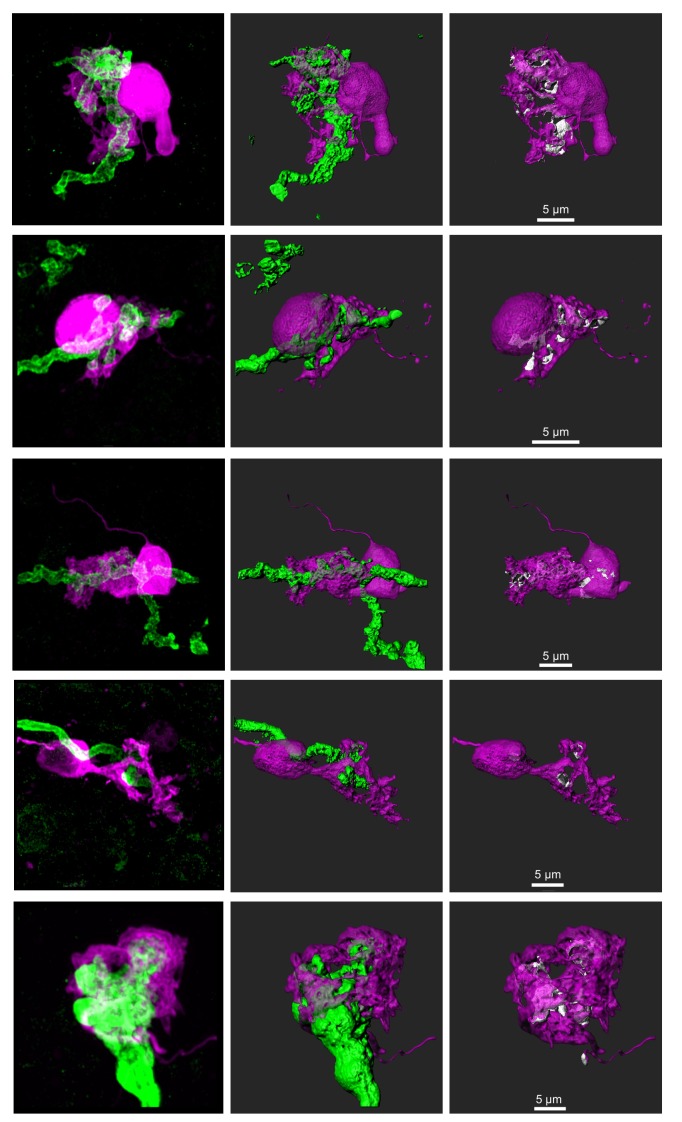
Figure 3—figure supplement 1. Additional UBCs that were filled with biocytin and recovered with an innervating primary afferent expressing ChR2-EYFP.

Figure 3—figure supplement 1.

Left- Biocytin filled UBC- magenta, EYFP/ChR2 labeled primary afferent- green. Maximum intensity projection. Center- 3D rendering. Right- UBC showing contact with mossy fiber (white). UBC in middle row is also shown in Figure 7A and Figure 8E.
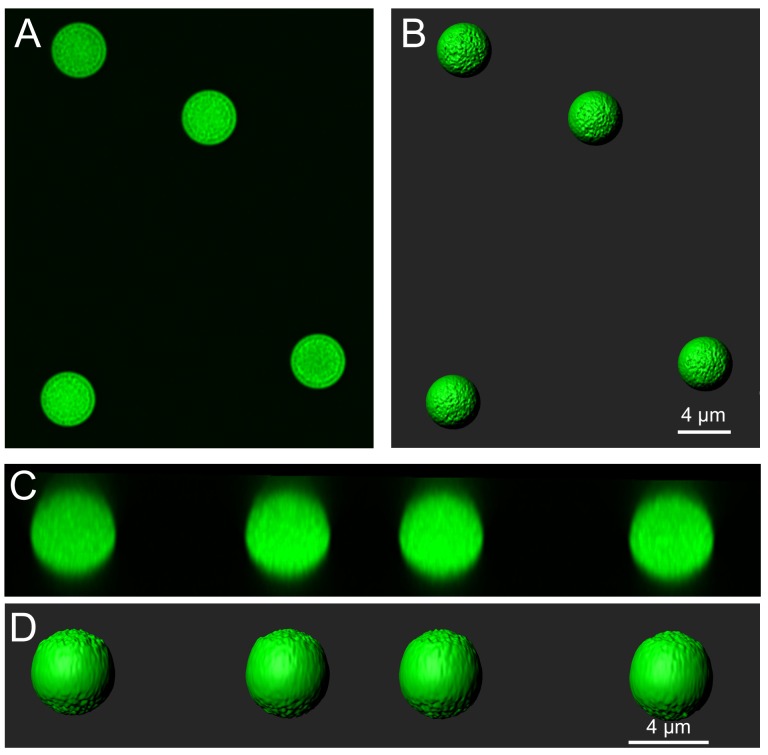
Figure 3—figure supplement 2. Imaging, surface construction and measurement of fluorescent spheres of known size.

Figure 3—figure supplement 2.

(A) Fluorescent spheres were mounted on microscope slides and imaged following the procedures used for the biocytin filled cells (see Materials and methods). These spheres had a mean diameter of 4.23 μm according to the information provided by the supplier. (B) Surfaces were made following the procedures used for filled cells and mossy fibers. (C) A side view of the super-resolution image stack shows that the z-resolution was not elongated. (D) A side view of the surfaces indicates that they are less smooth on the top and bottom of the stack, but was well fit to the fluorescence and clearly represented the spherical shape. Surface areas were calculated following the procedures used for biocytin filled cells. The mean surface area was 56.61 ± 1.68 μm2, n = 18,~1% greater than the expected surface area (56.21 μm2) given the mean diameter of 4.23 μm provided by the supplier. The volume was calculated to be 37.22 ± 2.23 μm3,~6% less than the expected volume of 39.63 μm3. This indicates that the approach used to measure the surface area and volume of filled cells in super-resolution images is reasonably accurate.
Figure 3—figure supplement 3. UBCs and granule cells receive disynaptic inhibitory input, likely via direct Golgi cell activation by primary vestibular afferents.

Figure 3—figure supplement 3.

(A) UBC with ChR2 evoked IPSCs. 2 ms blue light (blue bar) activated primary afferents and evoked IPSCs that were delayed and mediated by both GABAA and glycine receptors. Amplitudes were 28.92 ± 27.73 pA (mean ± SD), n = 23. Note that these responses are in the presence of 50 μM 4-AP. (B) In 5/6 UBCs 5 μM SR-95531 blocked the IPSC 31.5 ± 16.7% (mean ± SD). The addition of 0.5 μM strychnine blocked 94.0 ± 2.0% (mean ± SD) of the remaining current. (C) Granule cell with ChR2 evoked IPSCs. Gray traces are individual trials and black trace is the average. Amplitudes were 11.32 ± 8.02 pA (mean ± SD), n = 10, in the presence of 50 μM 4-AP. Delays from onset of light to beginning of the IPSCs were 5.52 ± 0.40 ms (mean ± SD), n = 10.
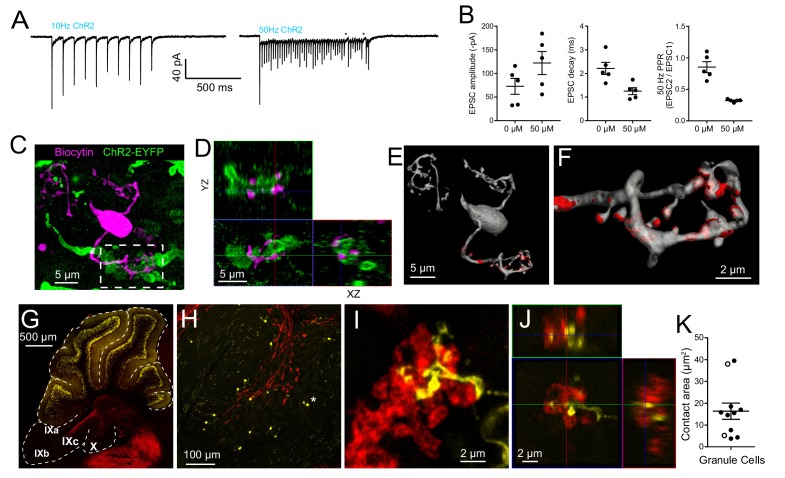
Figure 3—figure supplement 4. Granule cells receive primary vestibular synaptic input.

Figure 3—figure supplement 4.

(A) Granule cell responds to 10 Hz and 50 Hz ChR2 evoked synaptic stimulation. The input to this granule cell can follow 50 Hz light flashes, but fails towards the end of a 50 pulse train (stars). This example is in 50 μM 4-AP. (B) Granule cell EPSCs evoked by ChR2 stimulation of primary afferents in 0 or 50 μM 4-AP. (C) A granule cell filled with biocytin and recovered post hoc. Maximum intensity projection. (D) Orthogonal view of the boxed region in C, showing granule cell claw wrapping around mossy fiber. (E) Surface reconstruction of granule cell showing mossy fiber contact area in red 37.98 μm2). (F) Granule cell claw showing contact with brush in red. (G) The Glt25d2::tdTomato mouse was crossed with the TCGO mouse line that expresses mCitrine (yellow) in a very small, presumably random, subset of granule cells in cerebellum. The expression is especially sparse in lobes IX and X. (H) Higher magnification of lobe X shows sparse labeling of granule cells and even sparser UBCs (a single UBC indicated by *). (I) Granule cell claw contacting primary afferent. Maximum intensity projection. (J) Orthogonal view of mossy fiber to granule cell claw contact. No granule cell was observed to contact multiple mossy fibers with different claws or the same mossy fiber with multiple claws. (K) Summary of contact areas measured between primary afferents and granule cell claws. White circles were measured from biocytin filled granule cells.
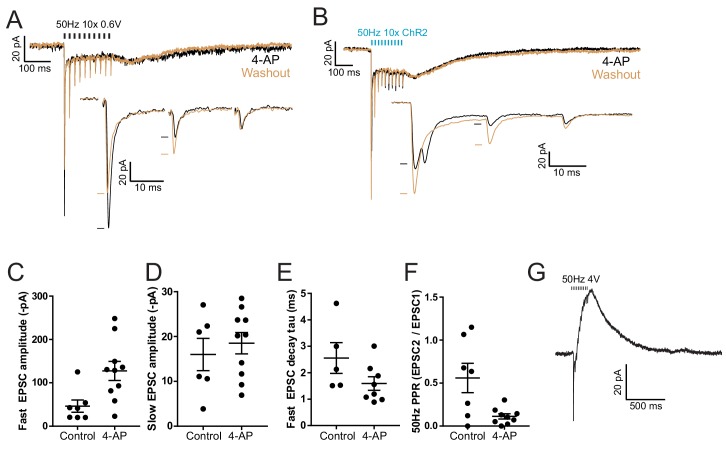
Figure 3—figure supplement 5. 4-AP has effects on the ChR2-evoked EPSC, but does not change whether the UBC response is ON or OFF type.

Figure 3—figure supplement 5.

(A) Example of response to electrical synaptic stimulation in 50 μM 4-AP (black) and after washout of 4-AP (brown). Inset shows the first 3 EPSCs in the train with a longer time base. 4-AP increases the amplitude of the EPSC, increases synaptic depression but has no effect on the recurrent slow EPSC that occurs at the offset of stimulation in ON UBCs. (B) In a different ON UBC, 4-AP washout had an effect on ChR2 evoked currents. In 4-AP, release was asynchronous. After washout the release became synchronous. In this cell and one other this asynchronous release was observed in 4-AP and changed after 4-AP washout. (C) The first ChR2 evoked fast EPSC amplitude was larger for cells that had 50 μM 4-AP in the bath. (D) Importantly, the slow EPSC at the offset of the stimulus train that is diagnostic of ON UBCs was inward whether or not 4-AP was present. (E) Decay of the first EPSC in the train with and without 4-AP. (F) Paired pulse ratio was lower in most cells in the presence of 50 μM 4-AP. (G) OFF UBC responses could be evoked by electrical stimulation in these Glt25d2::ChR2-EYFP slices with 4-AP present, indicating that the lack of OFF UBC responses evoked by primary fiber activation was not due to non-specific block of GIRK or mGluR2 or to the absence of OFF UBCs in this mouse line.