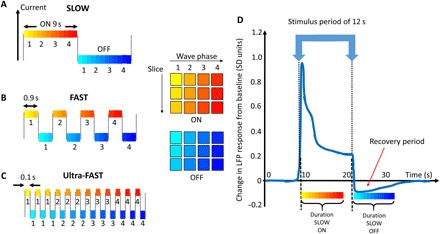
Fig. 2. Data collection schemes and LFP.

(A to C) Different colors schematically represent the elapsed time from a stimulus transient at which a slice/wave phase combination is acquired (here, three slices and four wave phases are shown, representatively). The SLOW (A), FAST (B), and Ultra-FAST(C) stimulus times (9 s, 0.9 s, and 100 ms) allow for acquisition of MRE data from all slice/wave phase combinations, all slices for a single wave phase, and a single slice/single wave phase combination, respectively. (D) Schematic representation of one section of the temporal local field potential (LFP) deviation from baseline for a 12-s block design visual stimulus [adapted from Fig. 5C from (16)]. The LFP shows a high transient response immediately after the stimulus is either switched ON or OFF. The Ultra-FAST acquisition is most sensitive to any transient response, whereas the SLOW acquisition is sensitive to the average response over its longer stimulus time.
