
Fig. 5. Modeling the hemodynamic response as a function of stimulus switching frequency fs.
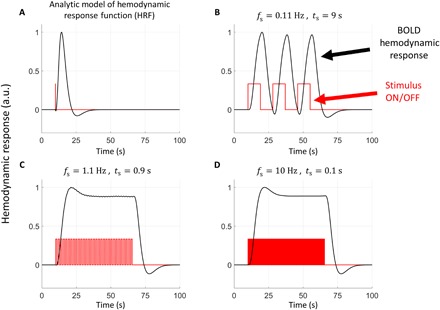
(A) Analytical model of cortical hemodynamic response function (HRF) based on measurements by Tian et al. (3). a.u., arbitrary units. (B to D) Convolution of the HRF analytical expression with stimulus switching at different values of fs. The code used to calculate these graphs was obtained from www.fil.ion.ucl.ac.uk/spm/software/spm12/. The change in the hemodynamic response between the stimulus ON and OFF states is significant for (B) and negligible for (C) and (D).