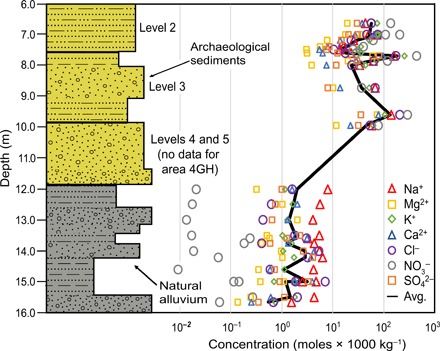
Fig. 3. Stratigraphic profile and soluble salt concentrations from area 4GH (see Fig. 1 for location) at Aşıklı Höyük.

(Left) Depth profile of the archaeological material and basal sediments, with specific major archaeological Levels 5 to 3 indicated. Alternating silt and sand represented by patterns on stratigraphic column, while grain size is shown through relative width of each section. (Right) Concentrations of seven soluble salts (see key) versus depth. The black curve denotes the average (Avg.) of all salts.
