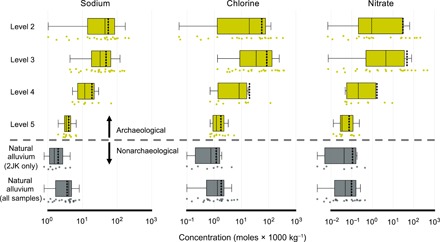
Fig. 4. Comparison of soluble salt concentrations between archaeological and nonarchaeological sediments.

(A) [Na+], (B) [Cl−], and (C) [NO3−] (in moles × 1000 kg−1) across major archaeological intervals (levels 5 to 2). Natural alluvium soluble salt concentrations from (i) all samples and (ii) samples directly beneath level 5 in area 2JK are provided only for comparison. Whisker lengths depict one-third of the interquartile range. The solid line within each box represents the median, while the dashed line shows the mean of the sample set. Data displayed here include general midden, dung-dominated midden, and alleyway samples combined.
