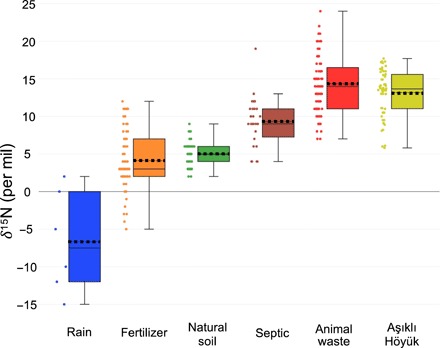
Fig. 5. δ15N values (in per mil) of refuse samples from Aşıklı Höyük compared to a range of sources of nitrates.

Whisker lengths denote one-third of the interquartile range. The solid line within each box represents the median, while the dashed line shows the mean of the sample set. Data not from Aşıklı Höyük are taken from (39–43).
