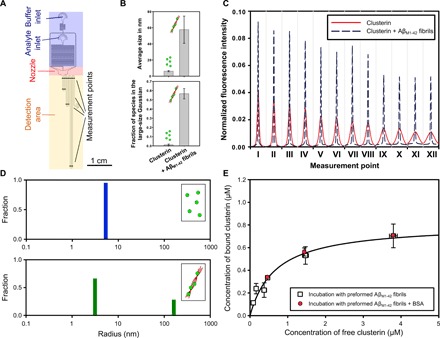
Fig. 3. Microfluidic analysis of clusterin binding to Aβ(M1-42) fibrils.

(A) Schematic diagram of the microfluidic diffusional sizing device used in this work indicating its most relevant components (33). (B) The bar charts show the average size and fraction of the species in the large-size range in the absence and presence of Aβ(M1-42) fibrils. The average sizes and the fraction of species in the large-size range reported are the means and SDs of at least three independent repetitions. (C) Diffusion profiles acquired at 12 different positions along the microfluidic channel for a 0.8 μM clusterin solution in the absence (red curves) and presence (black dashed curves) of 17.5 μM preformed Aβ(M1-42) fibrils in 20 mM sodium phosphate buffer at pH 8.0. (D) The size distributions in the absence (blue) and presence (green) of 2 μM Aβ(M1-42) fibrils were evaluated by fitting model simulations on the basis of advection-diffusion equations to the experimental diffusion profiles reported in (C) (see the Supplementary Materials). (E) Binding curve of clusterin to 17.5 μM Aβ(M1-42) fibrils in 20 mM sodium phosphate at pH 8.0 and 21°C measured by the microfluidic diffusion technique. In a first set of experiments (squares), different concentrations of clusterin were incubated with previously generated Aβ(M1-42) fibrils and size distributions were measured after 48 hours of incubation to ensure equilibrium conditions. In a second set of experiments (circles), different concentrations of clusterin were incubated with 17.5 μM Aβ(M1-42) fibrils and BSA at equimolar concentrations to clusterin. Each point represents the mean and SD of at least two independent repetitions. The regression line represents the best fit to the nonlinear Langmuir binding isotherm with KD = 0.67 ± 0.19 μM and M = 0.80 ± 0.08 μM [corresponding to one clusterin molecule per 21 Aβ(M1-42) monomers], with R2 = 0.97.
