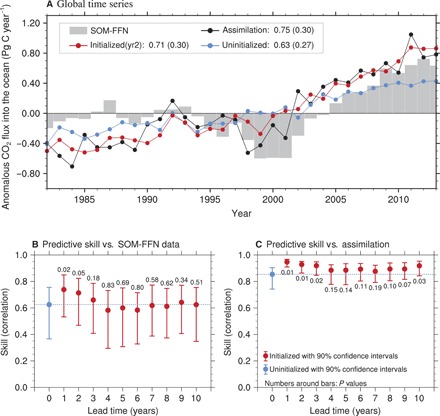
Fig. 1. Temporal evolution and predictive skill of the global CO2 flux into the ocean.

(A) Time series of anomalous CO2 flux into the ocean from SOM-FFN data–based estimates (15) and MPI-ESM simulations with respect to the climatological mean. Gray bars show SOM-FFN data. Assimilation, initialized simulation at a lead time of 2 years, and uninitialized simulations are shown in black, red, and blue, respectively. Here, the anomalies refer to conditions in which the respective climatological means are removed, and the positive values indicate anomalous uptake of CO2 by the ocean. The numbers show the correlation coefficients and root mean square error (in parentheses) against SOM-FFN data. (B) Correlation skill of the global CO2 flux into the ocean against SOM-FFN data–based estimates. The blue dot and red dots show the uninitialized correlation and initialized correlation at different lead years, respectively. The blue dashed line extends the uninitialized correlation for easy comparison. The vertical bars provide 90% confidence intervals, and the numbers above the bars show the P values based on a bootstrap approach (27). (C) The same as (B), but for correlation skill against assimilation.
