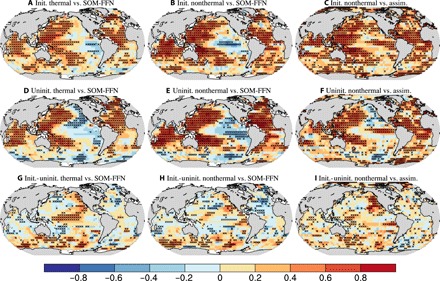
Fig. 3. Predictive skill of ocean surface pCO2 thermal and nonthermal components at a lead time of 2 years.

Columns 1 (A, D, and G) and 2 (B, E, and H) show the correlations between the initialized simulations and SOM-FFN data–based estimates for the thermal and nonthermal components, respectively. Column 3 (C, F, and I) shows the nonthermal part correlation between the initialized simulations and the assimilation. First row (A–C): Correlations with initialized simulations. Second row (D–F): Correlations with uninitialized simulations. Third row (G–I): Difference of the correlations between the initialized and uninitialized simulations. The values are computed over the years from 1982 to 2013 with the MurCSS tool for central evaluation of predictive skill (28). Crosses denote significant skill at the 95% confidence level based on a bootstrap approach (27). The thermal component correlation is based on pCO2sea, and the nonthermal component correlation is based on ΔpCO2 (pCO2sea − pCO2atm) (14).
