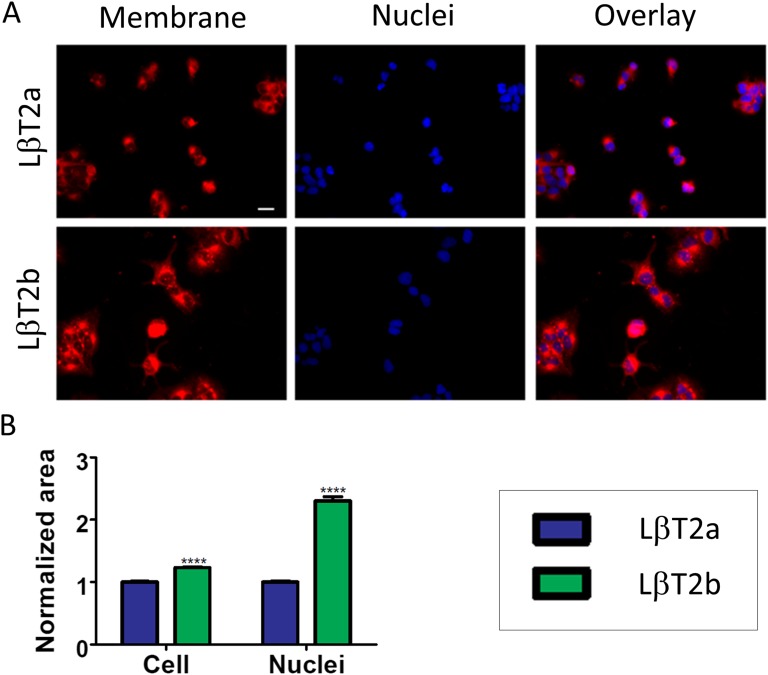
Figure 2.
Two genetically distinct LβT2 lines have different morphological features. (A) Micrographs of cells from the LβT2a and LβT2b lines using plasma membrane dye CellMask (left panel) and nuclear stain DAPI (middle panel). An overlay of both membrane and nuclear staining is shown in the rightmost panels. (B) Cell area and nucleus area measurements obtained in LβT2a and LβT2b using ImageJ. Cell area measurements were acquired in 269 cells from LβT2a and 198 cells from LβT2b, and nucleus area measurements were acquired in 1656 cells from LβT2a and 2180 cells from LβT2b. Data shown are from one of five independent experiments. Scale bar is 20 μm. Bars show median ± SE (error bars). ****P < 0.0001.

