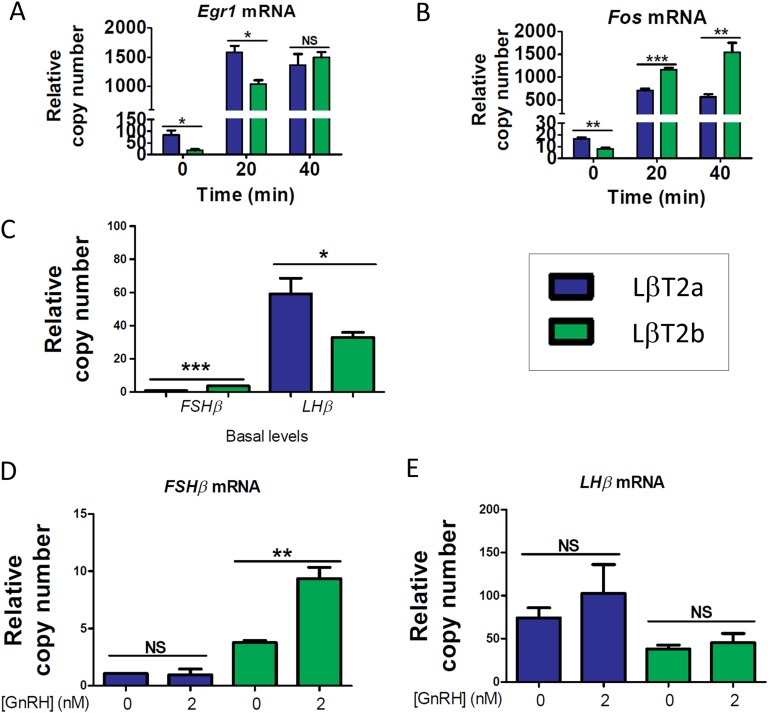
Figure 3.
Two genetically distinct LβT2 lines show differences in immediate early gene and gonadotropin subunit gene expression and induction by GnRH. Time course of GnRH induction of (A) Egr1 and (B) Fos in LβT2 cells (n = 6 biological replicates per time point). Gene expression was analyzed by qPCR. Cells were treated with 2 nM GnRH in 10% FBS medium for up to 40 min. (C) Basal expression of Fshb and Lhb is shown. (D) Fshb induction by GnRH is shown. (E) Lhb induction by GnRH in LβT2 cells (n = 4 biological replicates per condition) is shown. Gene expression was analyzed by qPCR. Following an overnight in a low-serum condition, cells were treated with 2 nM GnRH in a low-serum medium for 2 h, followed by 4 h in the absence of GnRH. Data shown are from one of three independent experiments. Bar graphs represent the median ± SE (error bars) of 4-6 biological replicates. *P < 0.05; **P < 0.01; ***P < 0.001. NS, nonsignificant.

