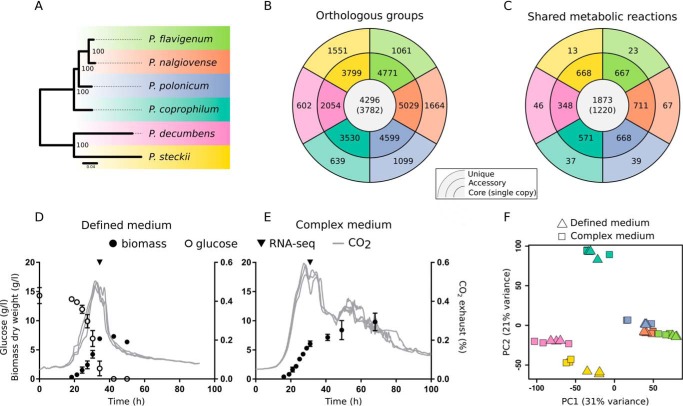
FIG 1.
Overview of study and comparative analysis of Penicillium species. (A) Phylogenetic tree of the species investigated in this study. The colors in the tree serve as a legend for the entire figure. (B and C) Numbers of genes (B) and reactions (C) within each of the species that are shared by all species (core), that are shared by a subset of species (accessory), or that are specific to one species (unique). (D and E) Example growth profile of Penicillium flavigenum in defined medium (D) and complex medium (E), indicating the time point of the RNA-seq sample (generated based on previously published data [14]). (F) Principal-component analysis of the six Penicillium species based on the normalized expression of single-copy core genes.

