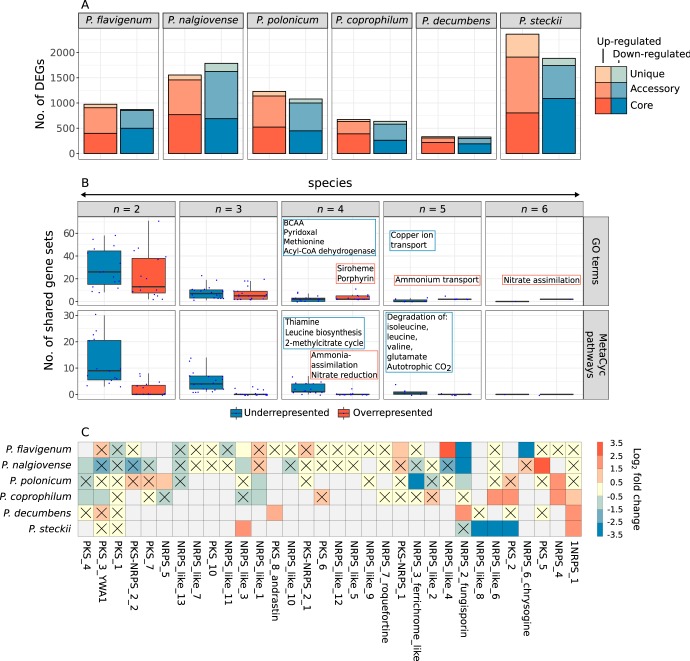
FIG 2.
Main transcriptional differences between the media. (A) Number of genes differentially expressed in complex medium versus defined medium. (B) Gene set enrichment analysis identifying cellular processes shared by at least two species. Each data point in the box plots represents a gene set enriched by a combination of n species and grouped between up- and downregulated genes. The main shared processes are written in the frames. The boxes in each box plot represent the first, second, and third quartiles, and the whiskers extend to the lowest/highest values that are within 1.5 the interquartile range (IQR). (C) Effect of the media on the expression of secondary metabolite backbone genes that were present in at least two species. Cells in the heat map marked with a cross represent backbone genes that were not significantly differentially expressed. Upregulation and downregulation refer to expression levels in complex medium compared to that in defined medium. Gray cells indicate backbone genes not detected in the species.

