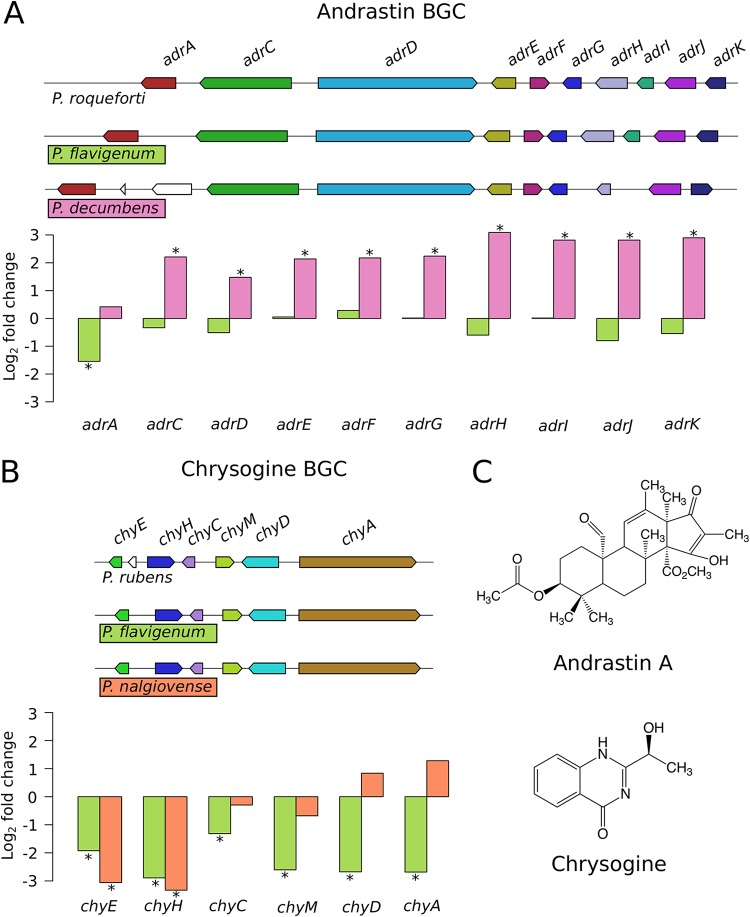
FIG 3.
Expression of biosynthetic gene clusters (BGCs) in Penicillium. Andrastin BGC (A), chrysogine BGC (B), and chemical structures of the end products of the pathways (C) are shown. Bar plots represent the log2 fold change in expression levels in complex medium (CM) relative to defined medium (DM), and the colors of the bars correspond to the species. Asterisks denote genes that were significantly differentially expressed.

