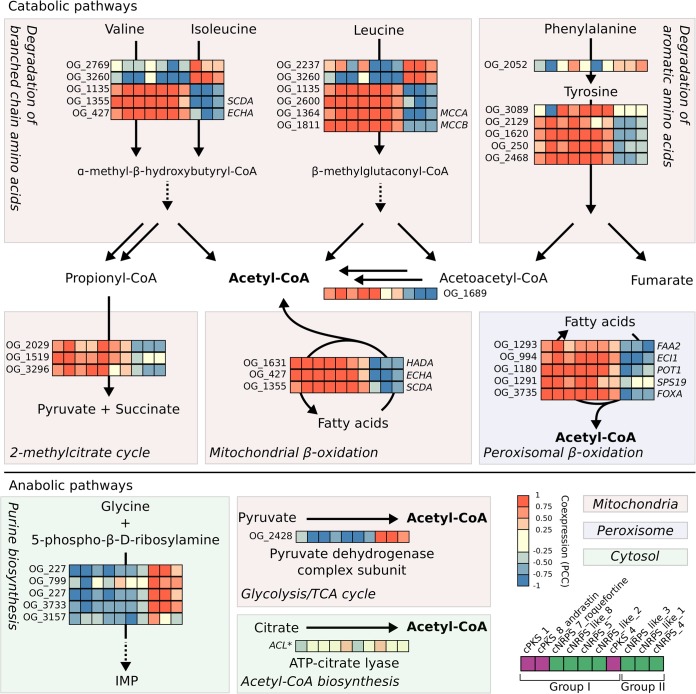
FIG 5.
Main metabolic pathways correlating with secondary metabolite backbone genes. Heat maps represent backbone genes in the columns (as specified in the figure key) and orthologous groups (OG) responsible for the catalysis of the reactions in the pathways as rows. The figure key indicates PKSs in purple and NRPSs in green. Coexpression with genes marked with an asterisk was calculated for only five of the species. TCA, tricarboxylic acid.

