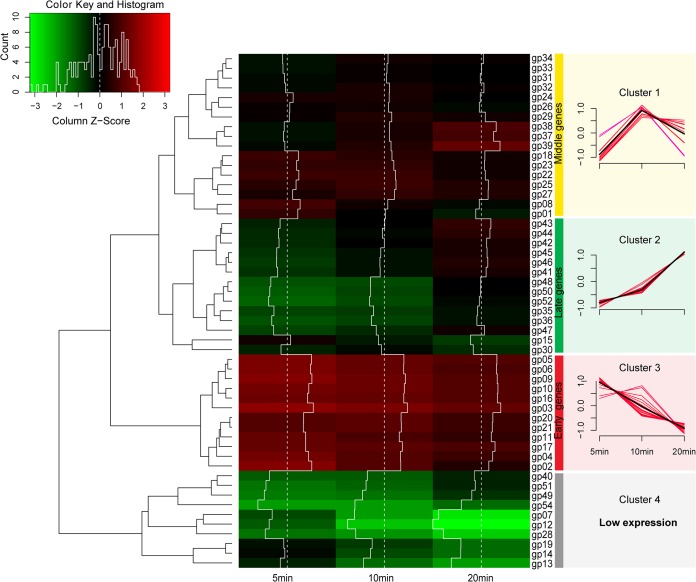
FIG 2.
Transcriptomic profile of φAbp1 genes in the host cells. (Left) Hierarchical cluster heat map of φAbp1 genes; (right) expression level of each cluster of φAbp1 genes. Based on the FPKM values of genes, hierarchical cluster analysis was performed using ward.D2 and Minkowski methods. A total of 54 φAbp1 genes (gp01 to gp54) were clustered into 4 clusters (clusters 1 to 4).

