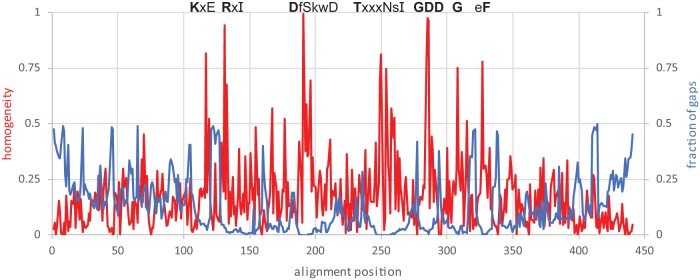
FIG 1.
Sequence conservation profile along the core alignment of the RdRps and RTs. The homogeneity metric is based on the BLOSUM62 scores between the consensus amino acid and the actual amino acids in the alignment column and are scaled from 1 (all residues are the same) to 0 (the score is not different from the random expectation). The fraction of gaps is computed using sequence weights (6). The amino acids conserved in five prominent motifs are shown. The conservation of a residue is indicated as follows: bold uppercase letter, homogeneity of ≥0.9; uppercase letter, homogeneity of ≥0.75; lowercase letter, homogeneity of ≥0.3; x, homogeneity of <0.3.

