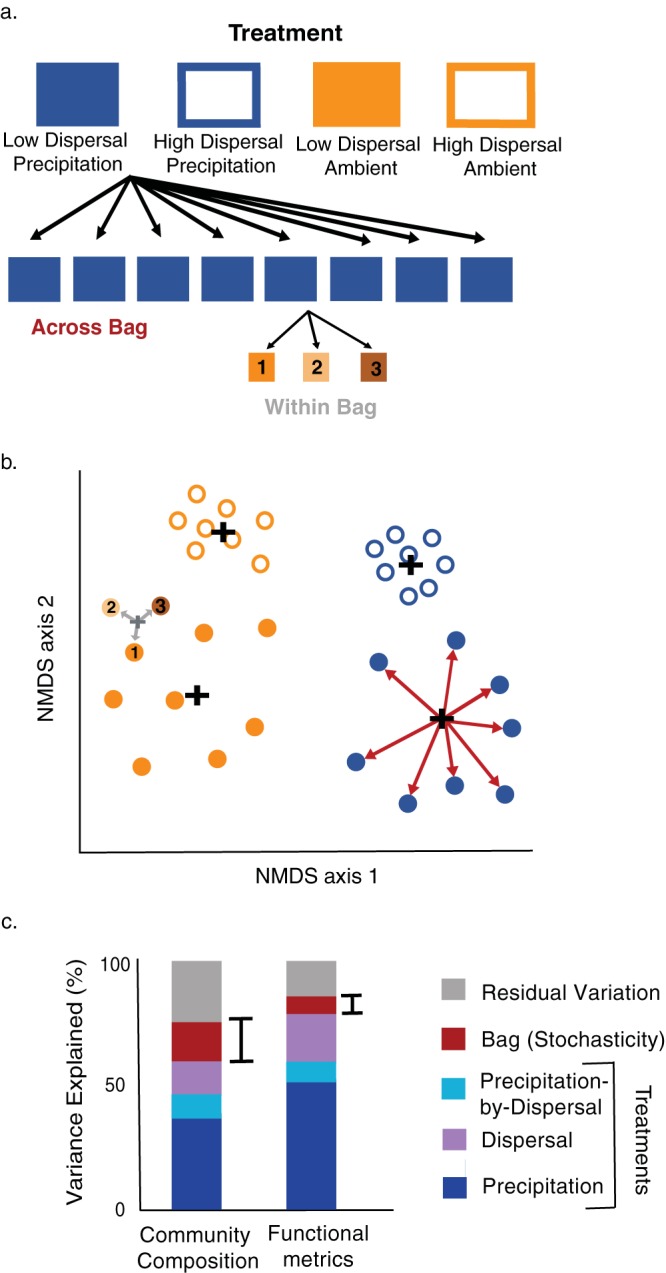
FIG 1.

(a) Schematic diagram of experimental design. Four treatments were replicated eight times for a total of 32 litterbags containing homogenized leaf litter communities on a common litter substrate. To account for spatial heterogeneity within a litterbag, we assayed compositional and functional metrics on three subsamples from each of the litterbags. (b) Ordination showing hypothesized variation in community composition. Black crosses indicate group centroids of the different treatments and distances between the black crosses reflect variation among treatments. Within-treatment variation is denoted by red arrows. This variation was calculated after accounting for within bag variation (shown here for just one bag denoted by gray arrows and gray centroid). (c) Hypotheses for the relative variations in community composition and ecosystem function metrics. Variations due to the treatments (precipitation [blue], dispersal [purple], and a precipitation-by-dispersal interaction [light blue]) correspond to the distances between the centroids indicated in panel b. Variations due to stochasticity (red) correspond to the red arrows in panel b. Similarly, residual variations (gray) correspond to the gray arrows in panel b.
