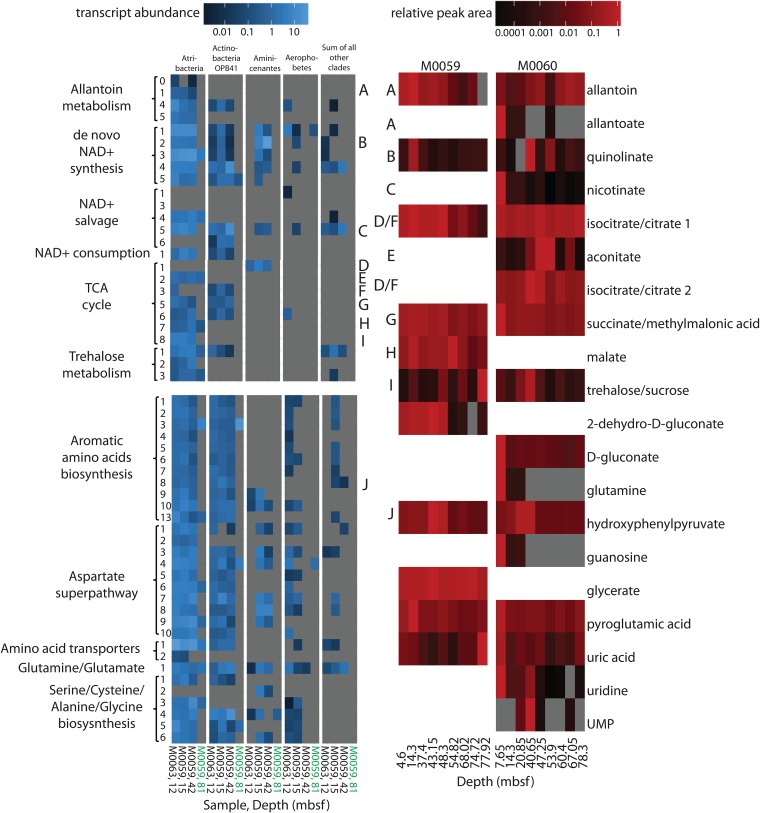
FIG 4.
Metabolic pathways for most metabolites were transcribed differentially among deep subsurface community members. Transcript abundance (blue, coverage of each base pair in gene divided by gene length), summed from SAGs in each of the five lineages listed across the top, for the pathways for the metabolites (red, peak areas divided by largest peak area for that metabolite). Letters connect encoded enzymes to their metabolite. Enzymes for each numbered step in the pathway are listed in Table S2. All identified metabolites are shown. Products below detection limit are in gray. Samples for transcripts are marine (black) or lacustrine (green).

