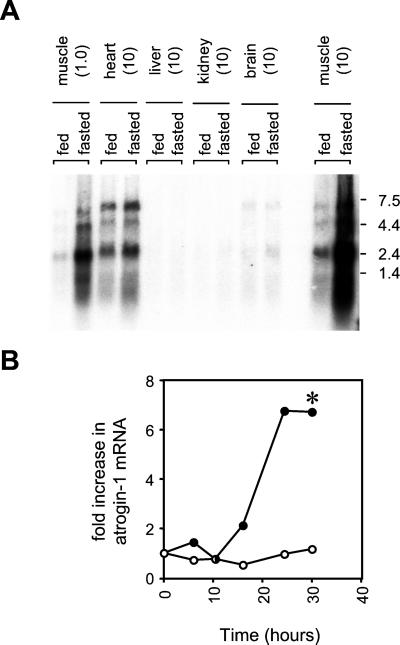
Figure 3.
(A) Tissue distribution of atrogin-1. Total RNA was extracted from the pooled tissues of eight control or eight, 2 d food-deprived mice by using TRIzol reagent. RNA was electrophoresed on a 0.8% formaldehyde-agarose gel, transferred to a Zeta-Probe membrane (Bio-Rad), and UV crosslinked. The quantity of RNA loaded (in micrograms) for each tissue is in parentheses. A gel-purified KpnI/XbaI fragment of the atrogin-1-coding sequence (bp 1,500–2,368) was used as a probe for the atrogin-1 transcripts. The probe was labeled by random priming (Prime-It Kit, Stratagene). Hybridization was performed by the method of Church and Gilbert (17) at 65°C. Hybridized membranes were analyzed by using a Fuji Phosphorimager. Blots were stripped and rehybridizing with a mouse glyceraldehyde-3-phosphate dehydrogenase probe (GAPDH, Ambion, Austin, TX) to ensure equivalent gel loading. (B) Time course of atrogin-1 expression in gastrocnemius muscle. The 48 C57BL6 mice were split into two groups at time = 0: 24 animals were transferred to cages without solid food, whereas the remaining 24 animals were maintained with food. At indicated times, four animals from each group were killed, gastrocnemius muscles weighed, and total RNA extracted by using TRIzol reagent. Northern blots were performed as above by using 10 μg of total RNA/lane from the pooled control and fasted muscle at each time point. Atrogin-1 band intensities were quantitated by densitometry, and membranes reprobed with a mouse GAPDH probe to ensure equal RNA loading. The fold increase in atrogin-1 mRNA was derived by dividing the corrected atrogin-1 band intensity (atrogin-1/GAPDH) at each time point with the corrected band intensity at t = 0. ○ fed; ● fasted. *, Muscle weight loss was significantly greater (P < 0.05) in fasted compared to fed animals after 30 h but not earlier time points (see text).

