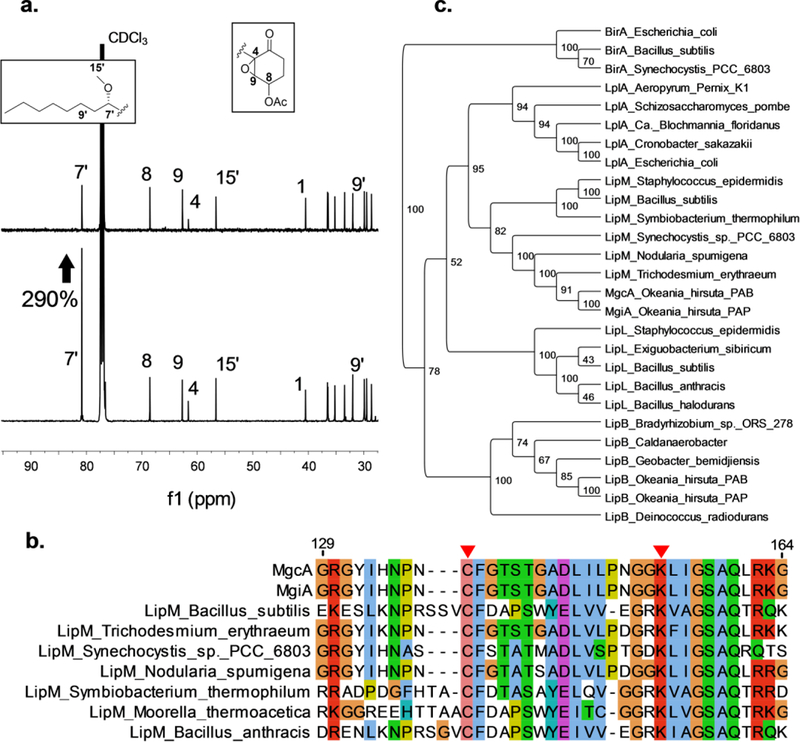
Figure 3.

[1-13C]octanoate fed batch enrichment and LipM phylogeny. a) Comparison of 13C-NMR C-7', C-8, C-9, C-4, and C-15' resonances from malyngamide C acetate isolated from native abundance sample (top) and sample fed with [1-13C]octanoate (bottom). Percentage increase in intensity of C-7' signal depicted next to C-7' signal. b) alignment of LipM octanoyltransferases with MgcA/MgiA. Active site cysteine and lysine are indicated with red triangles. c) Phylogenetic tree of select PFAM03099 protein sequences. Topology threshold percentages depicted at node junctions.
