Figure 4.

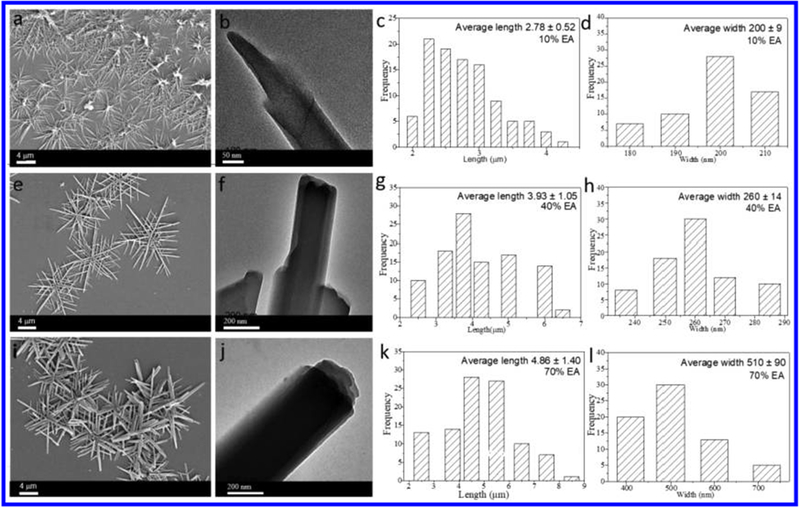
SEM images and corresponding size histogram of nanostructures formed from cage 1 (10 μM) in DCM/EA mixtures (freshly prepared) with 10% (a–d), 40% (e–h), and 70% EA (i–l).

SEM images and corresponding size histogram of nanostructures formed from cage 1 (10 μM) in DCM/EA mixtures (freshly prepared) with 10% (a–d), 40% (e–h), and 70% EA (i–l).