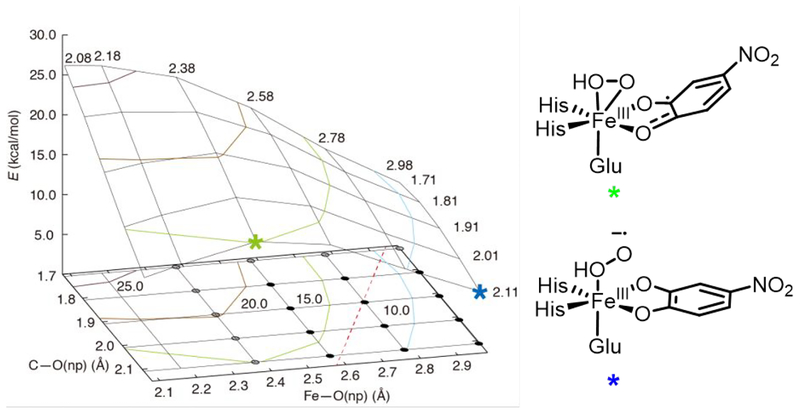
Figure 13.
A 3D plot of the 2D PES for generating a hydroperoxy bridged intermediate (2b) from the side-on FeIII-hydroperoxy-semiquinone intermediate 1b. The Fe-O(np) bond length is increased along the y-axis, while the O(np)-C2(substrate) distance is increased along the x-axis. All energies shown on the z-axis are electronic energies in kcal/mol with the energy of 1b set to 0 kcal/mol. The reactant 1b and product 2b are not shown on this PES as these would appear at the bottom-left and upper-right portions of the PES, respectively. The dashed red line shows the direct path connecting 1b and 2b, and a 2D contour map showing the positions of 1b and 2b is given in the SI (Figure S16). The black and gray circles indicate species having β-spin density on the distal oxygen atom: the gray circles have β-spin density less than 0.1 on O(np) and thus primarily peroxy character, and the black circles have β-spin density more than 0.1 and thus significant superoxy character. The green and blue stars denote specific structures on the 2D PES that are described in the text; these structures are shown on the right.

