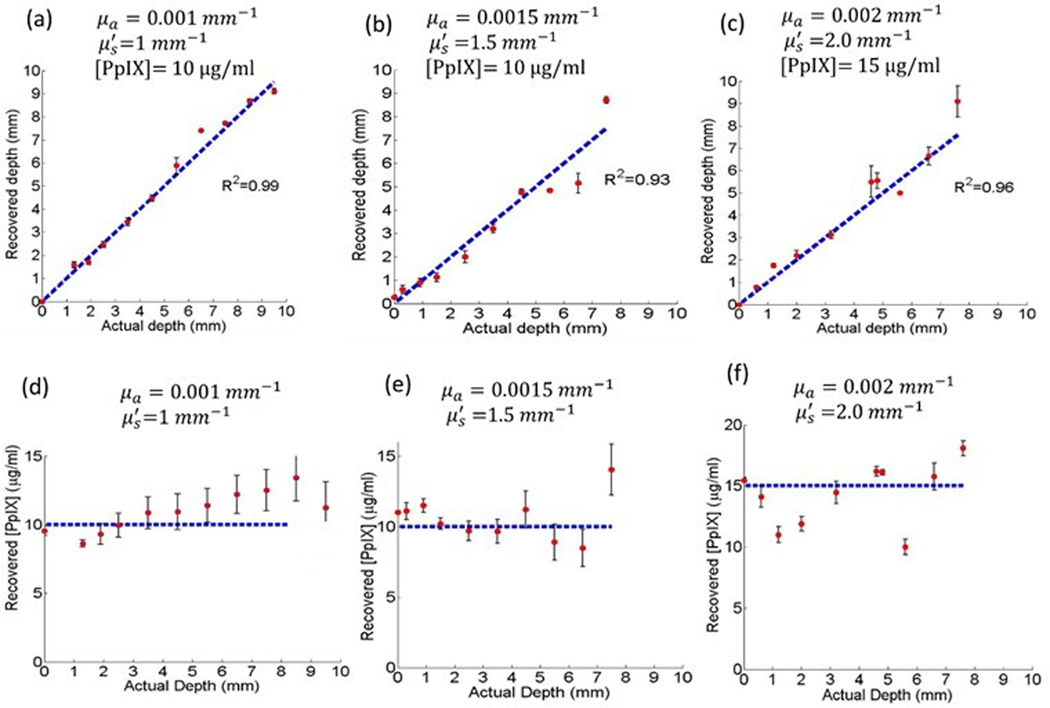
Figure 2.
(a-c) Recovered depths for phantoms with different optical properties and PpIX concentrations. The best fit to the line of equality is indicated. Error bars are the standard deviation from 3 replicates. (d-f) Recovered [PpIX] for three phantoms with different optical properties and [PpIX] values as indicated by the horizontal dashed lines. Error bars are the standard deviation from 3 replicates.

