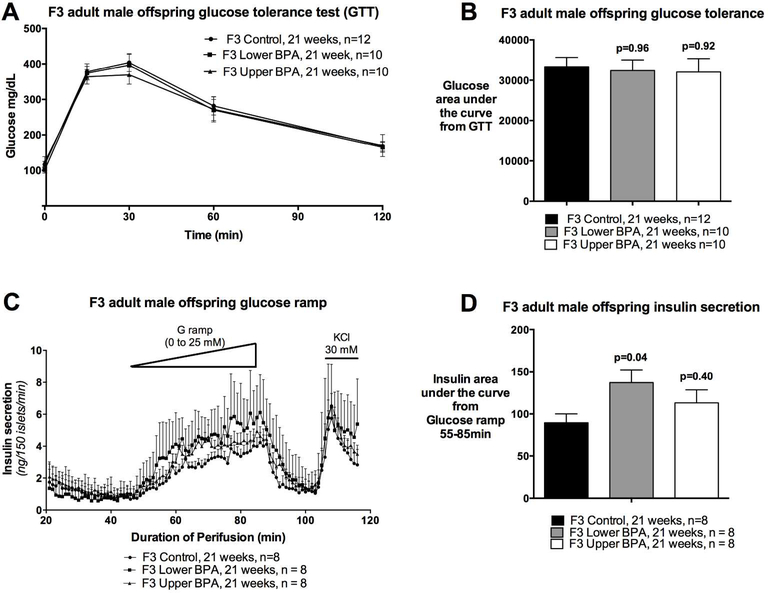
Figure 2. Glucose tolerance test, and insulin secretion in F3 adult male offspring.
A) Curve from glucose tolerance test, B) Glucose area under the curve from the glucose tolerance test, C) Insulin secretion on islet perifusion with increasing concentration of glucose (from 0 to 25 mM) on a glucose ramp, potassium chloride (KCl) used as a depolarizing positive control, and D) Glucose stimulated insulin secretion determined as insulin area under the curve from time 55 to 85 min of the glucose ramp. Data are individual litter data (one animal per litter; n=8–12 litters per group), and presented as mean + SEM, and analysed using Dunnett’s test. P values are relative to Control.

