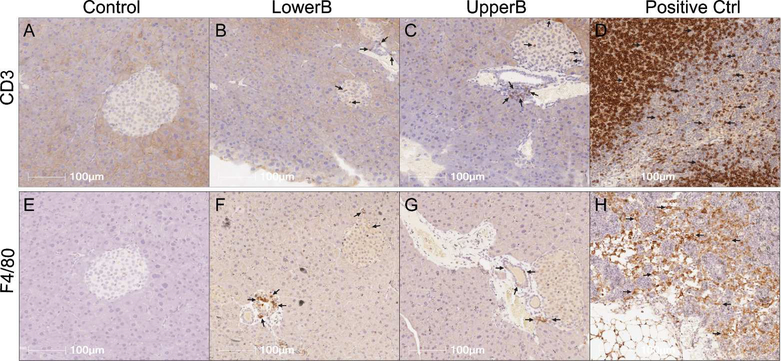
Figure 4. Representative photomicrographs of pancreatic immunohistochemical staining in F3 male offspring.
(A to D) Sections stained for CD3: cluster of differentiation 3, marker for T lymphocytes, and (E to H) Sections stained for F4/80: marker for macrophages. LowerB (Lower BPA), UpperB (Upper BPA), Positive Ctrl (internal control- lymph node). Image magnified 20X. One animal per litter; n=6 litters per group.

