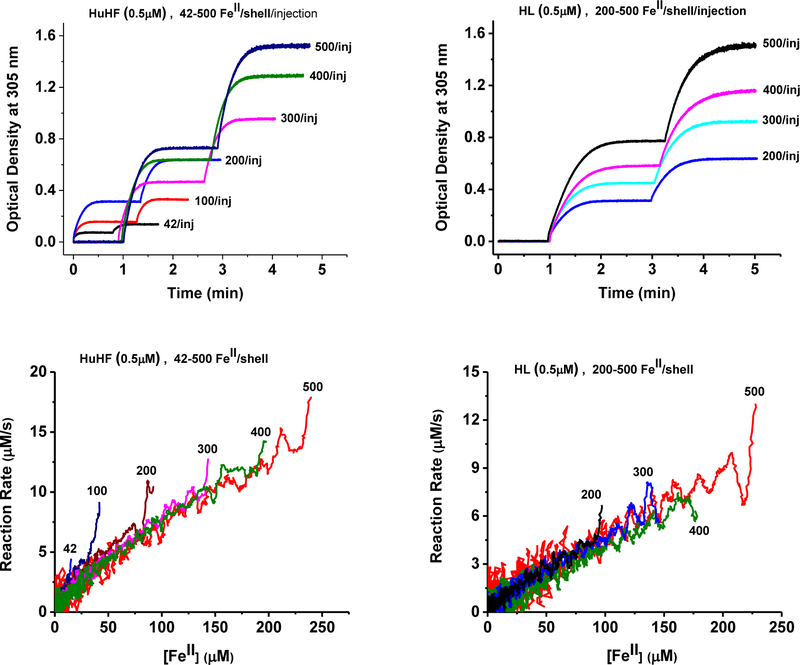
Figure 3.
Top: Representative kinetic curves for two successive injections of the same amount of FeII/shell, as indicated on each plot, in the presence of HuHF (left) or HL ferritin (right). Bottom: Plots of the reaction rates vs. the concentration of remaining iron(II) cations in solution following the second addition of Fe(II) to the same protein sample (as shown on each panel), HuHF (left), and HL (right). The experimental conditions are the same as in Figure 1.

