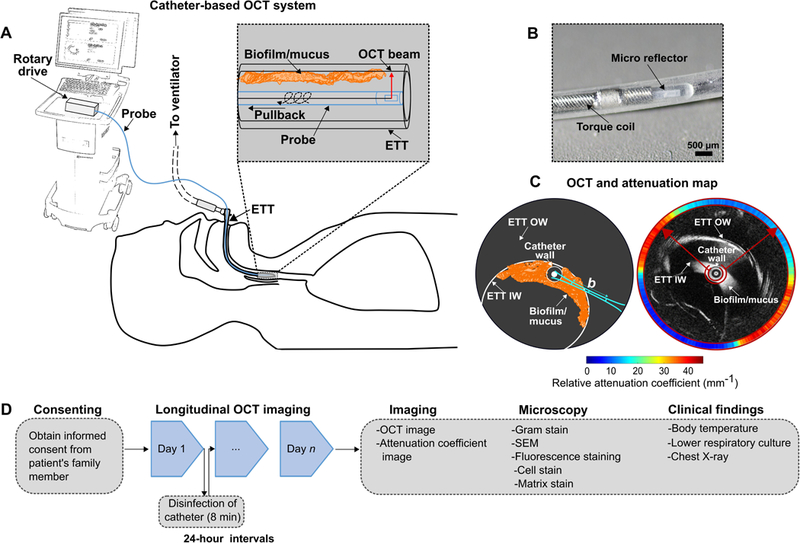
Figure 1.

Illustration of in vivo ETT imaging of intubated critical care patients using the catheter-based 3-D OCT system. (A) The OCT system used for imaging of biofilms or mucus in the ETT of the intubated subjects. (B) Magnified image showing the distal end and micro-optics of the OCT imaging catheter (Dragonfly C7). (C) Schematic illustration and representative OCT and attenuation coefficient image of an ETT. The OCT system will image the biofilm/mucus formed at the inner surface of the ETT. The approximate location of the OCT beam focus and confocal parameter or depth-of-field (b) is shown. An optical attenuation coefficient map was generated to differentiate between mucus and biofilm. The attenuation coefficient map corresponds to the mean attenuation coefficient values of the biofilm or mucus, measured from within the inner red ring shown overlaid with the OCT image, and further described in the Methods section. (D) Study flowchart. Following informed consent, imaging was performed to demonstrate the detection, formation, and differentiation of biofilm from mucus at 24 h intervals. OCT images were analyzed based on the differing optical attenuation coefficients. After extubation, ETT tubes were fixed and processed for conventional staining techniques and correlated with OCT images and clinical reports. ETT IW: ETT inner wall; ETT OW: ETT outer wall; b: depth-of-field.
