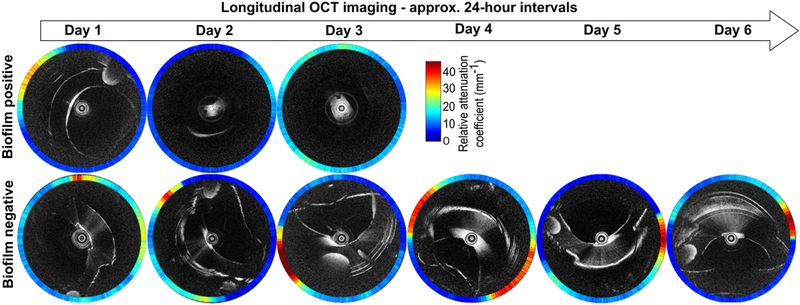
Figure 2.

Representative longitudinal in vivo OCT and RAC images from two intubated critical care subjects using the catheter-based OCT system. The top row shows representative longitudinal OCT images of an ETT without a biofilm present (Subject 6, extubated after 3 days). The bottom row shows representative longitudinal OCT images of an ETT with the presence and development of a biofilm (Subject 2, extubated after 6 days). Note that the RAC values are represented by a colored circumferential ring around each OCT image that corresponds to the radial RAC value through the biological material present around the catheter.
