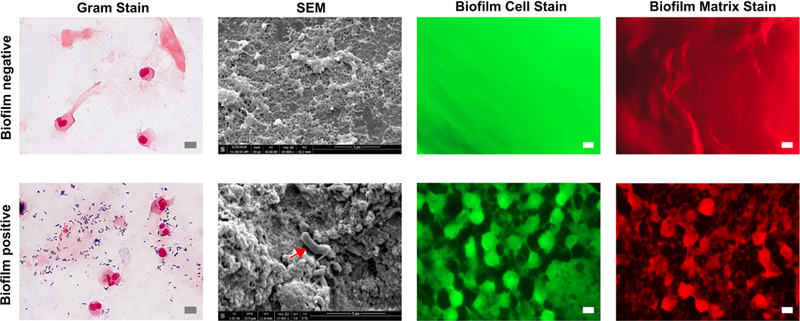
Figure 5.

Representative photomicrographs of biofilm-negative (top row) and biofilm-positive (bottom row) samples from ETTs. Gram stain of a paraffin-embedded biofilm-positive sample shows clusters of bacteria. SEM image shows the biofilm matrix along with embedded bacteria (red arrow). Bacterial cells and biofilm matrix appear when stained with FM-1-43 and SYPRO Ruby Red, confirming the presence of the ETT biofilm. Scale bars represent 5 μm.
