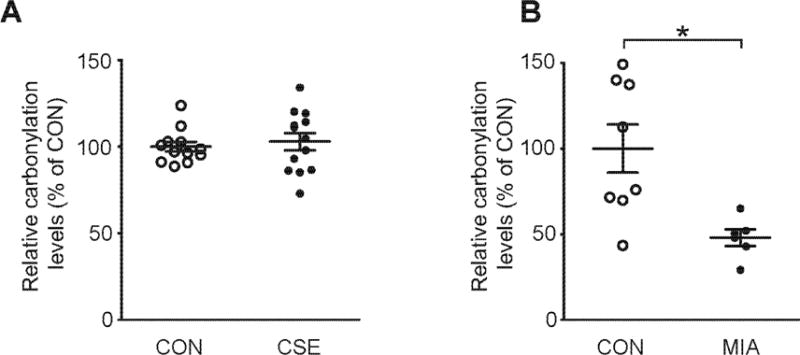
Fig. 3. Oxidative stress in CSE and MIA.

(A) Relative carbonylation levels of protein in the PFC of CSE mice. No significant differences between CON and CSE mice were detected. N=12-13. p=0.6228, as analyzed by Student’s t-test. (B) Relative carbonylation levels of protein in the PFC of MIA mice. MIA mice showed significantly reduction in relative carbonylation levels of protein. N=6-8. *p<0.05, as analyzed by Mann–Whitney U-test (p=0.0118). Data are presented as mean ± S.E.M.
