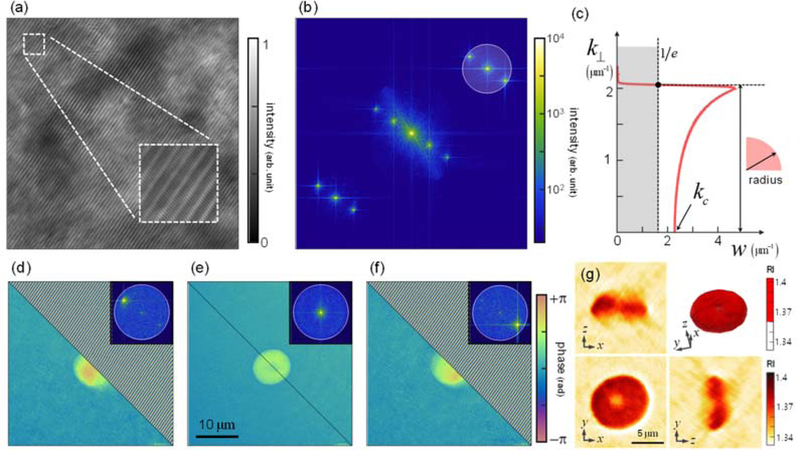
Fig. 6.
Experimental demonstrations. (a) Interferogram measured with incoherent illumination. (b) Panel (a) in k-space. The off-axis sampling area is indicated with a black-lined circle, whose radius is defined by (c) the weight function. (d-f) The retrieved sample phase maps corresponding to each peak in (b). Phase ramp is compensated for half of the images to visualize the sample information. (g-j) Corresponding reconstructed 3-D RI tomogram.

