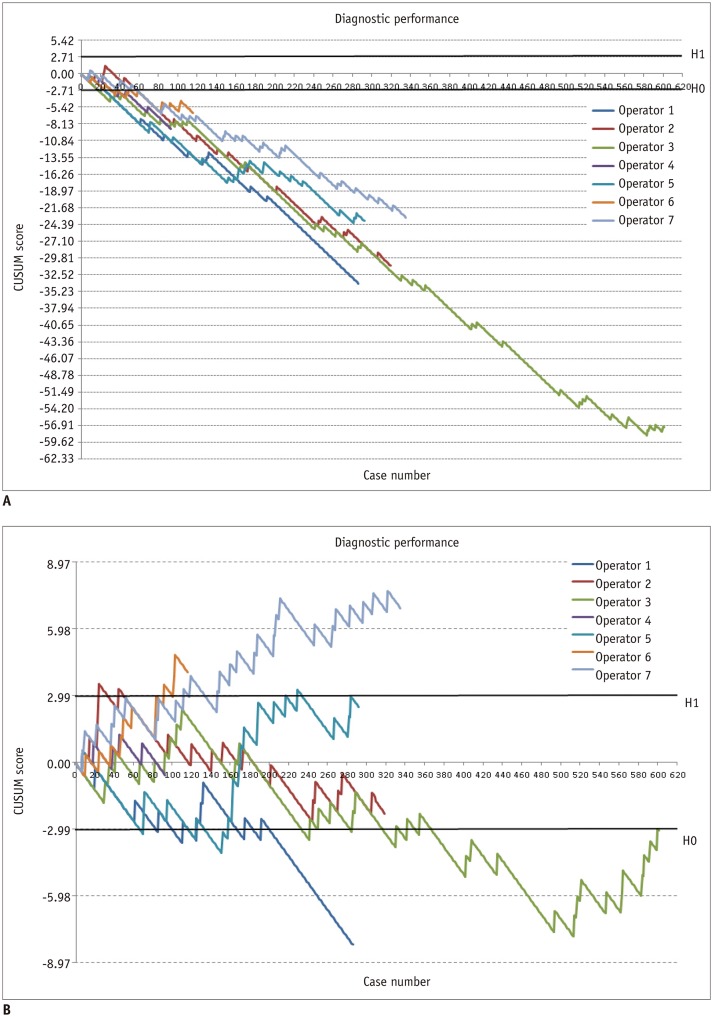
Fig. 3. Impact of failure rate on CUSUM graphs. Standard CUSUM graphs using different failure criteria.
A. When less strict failure rates were applied (p0 = 0.10, p1 = 0.20), all operators achieved proficiency after median of 33 procedures. B. When more harsh failure rates (p0 = 0.04, p1 = 0.08) were applied, only 2 reached lower decision limit and 2 operators crossed upper decision limit, suggesting poor performance, even after finishing their training.

