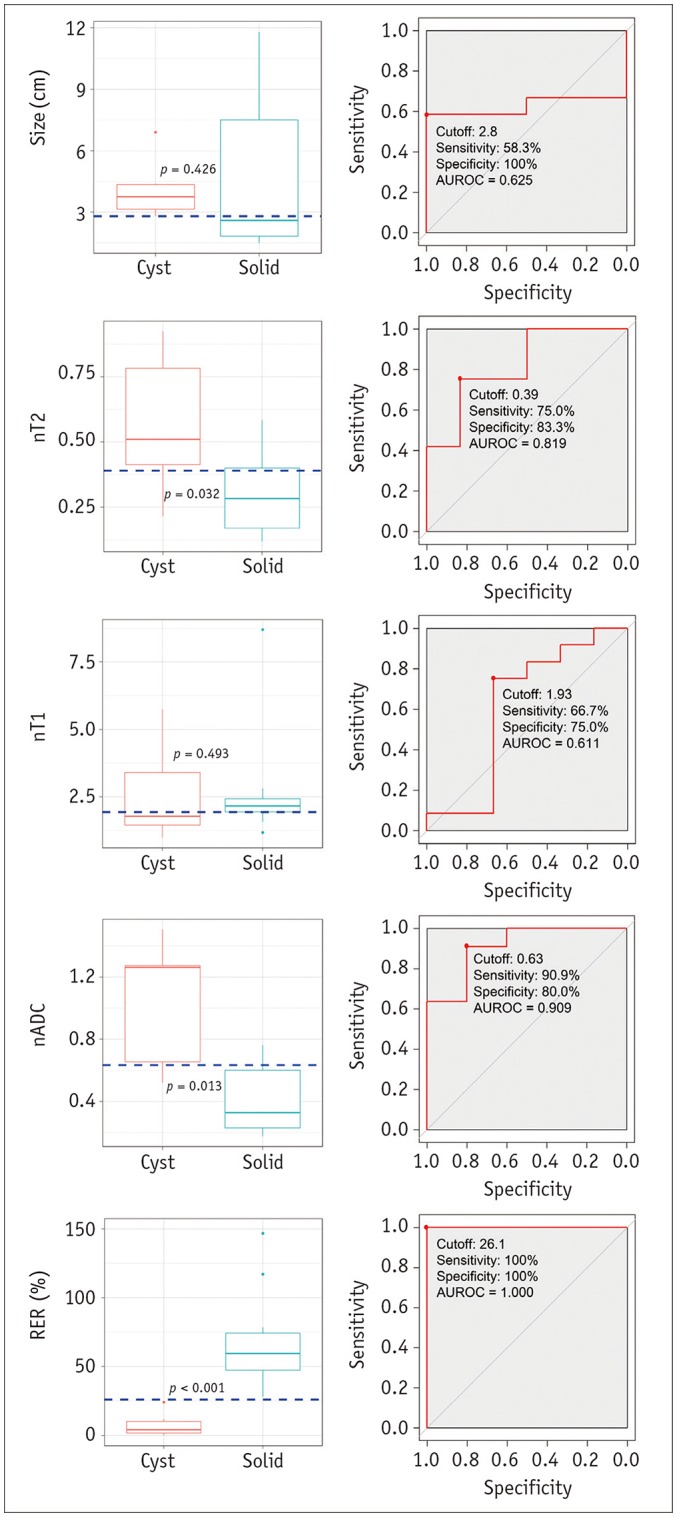
Fig. 3. Boxplots and ROC curves for differentiation between cysts and solid masses in development dataset.

Boxplots in left column show results of comparison of image variables between cysts and solid masses. nT2, nADC, and RER differed significantly between cysts and solid masses. Horizontal dashed lines indicate cutoff values developed in ROC analyses. ROC curves in right column show results of ROC analyses for differentiation between cysts and solid masses. Although nT2, and nADC appeared to be significant variables, RER showed perfect separation between cysts and solid masses. nT2, nT1, and nADC are fraction values without units. AUROC = area under receiver operating characteristic curve, ROC = receiver operating characteristic
