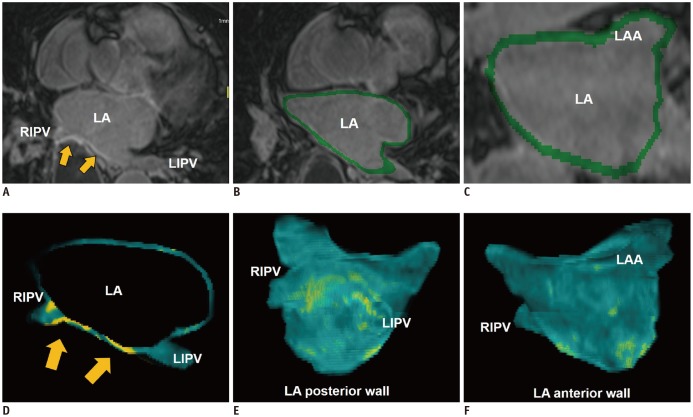
Fig. 3. LA fibrosis determined with 3D LGE-CMR imaging.
3D LGE-CMR image (A) with excellent spatial resolution describes thin LA wall and hyperenhancement areas (arrows) in detail. Segmentation of thin LA wall with slice thickness of < 2 mm (B, C) can reconstruct 3D LA models (D–F) which show tissue composition of LA wall in basis of signal intensity of LGE (arrows, yellow foci). LGE = late-gadolinium enhancement, LIPV = left inferior pulmonary vein

