. 2018 Nov 19;43(2):222–235. doi: 10.4093/dmj.2018.0020

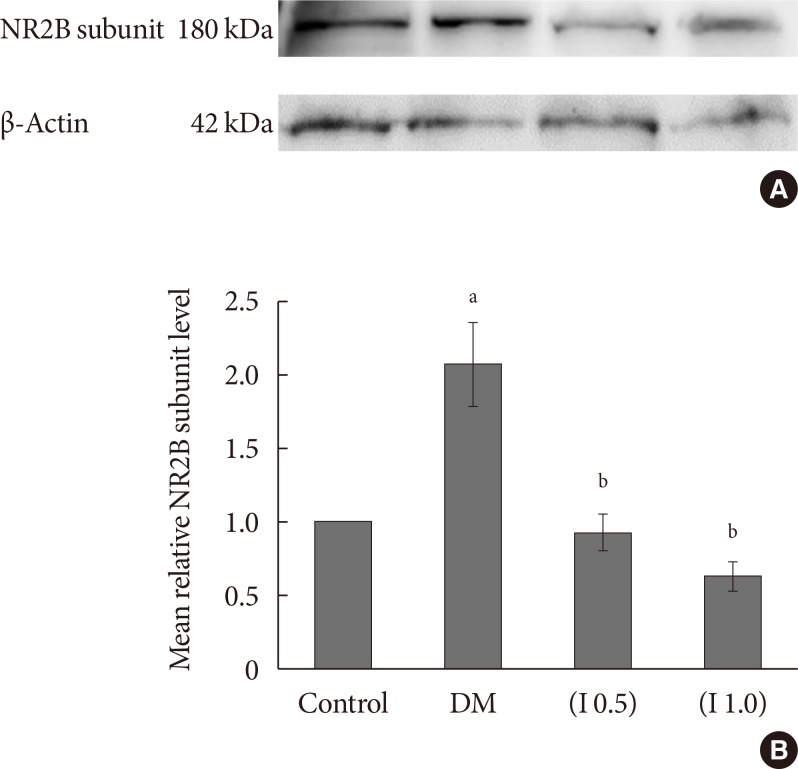
Fig. 6. (A) A representative example of Western blot results for total NR2B subunit on the ipsilateral side between all groups with quantification analysis of the integrated density value. (B) Columns represent the mean relative total NR2B subunit protein level±standard error of the mean for eight separate experiments. The mean relative total NR2B subunit protein level (fold change) represents comparative levels of the total NR2B subunit protein in the experimental groups (diabetes mellitus [DM], DM group treated with ifenprodil at lower dose, I 0.5 and DM group treated with ifenprodil at higher dose, I 1.0) over the calibrator group (control group) after normalization by its loading control (housekeeping protein, β-actin protein) (n=8 for each group). aP<0.05 compared to control group, bP<0.001 compared to DM group.

Fig. 6