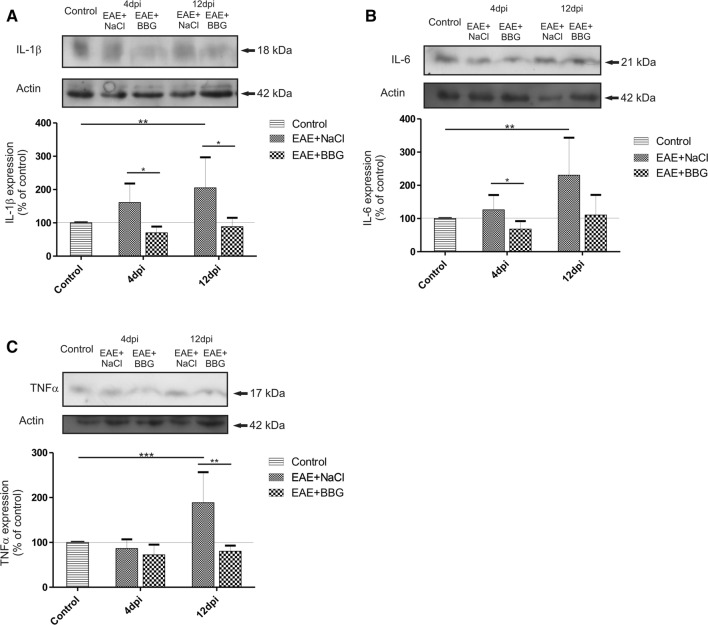
Fig. 4.
Representative immunoblot showing the expression of a IL-1β; b IL-6; c TNF-α protein in asymptomatic (4 d.p.i.) and symptomatic (12 d.p.i.) phases of the disease in brain homogenates of control and immunized rats treated or not with BBG. The graph indicates the results of densitometric measurements of 3–4 independent immunoblots performed using 3–4 distinct forebrains and expressed as a percentage of control. The relative density was calculated against actin as an internal standard. *p < 0.05, **p < 0.01 and ***p < 0.001 vs. EAE group or control non-immunized group (one-way ANOVA with the post hoc Dunnett’s test)

