
Fig. 2.
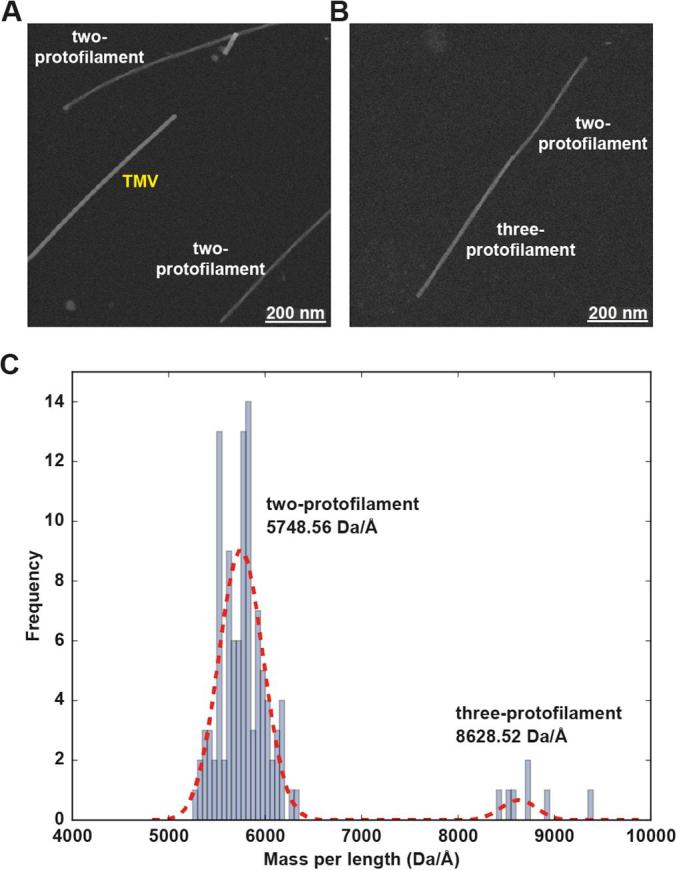
STEM analysis of unstained and freeze-dried mouse α-synuclein (mAS) fibrils. (A) Dark-field STEM image of tobacco mosaic virus (TMV) rods and mAS fibrils. TMV was used as an internal calibration standard (see also SI Appendix, Fig. S1). (B) Two or three protofilaments are axially adjoined in an mAS fibril. (C) Histogram of the mass-per-length (MPL) distribution for mAS fibrils. The MPL distribution was fitted using a bimodal Gaussian function as shown by the red dashed line. Values shown are means. Note that the MPL ratio of two- to three-protofilament fibrils is 2:3, exactly as expected.