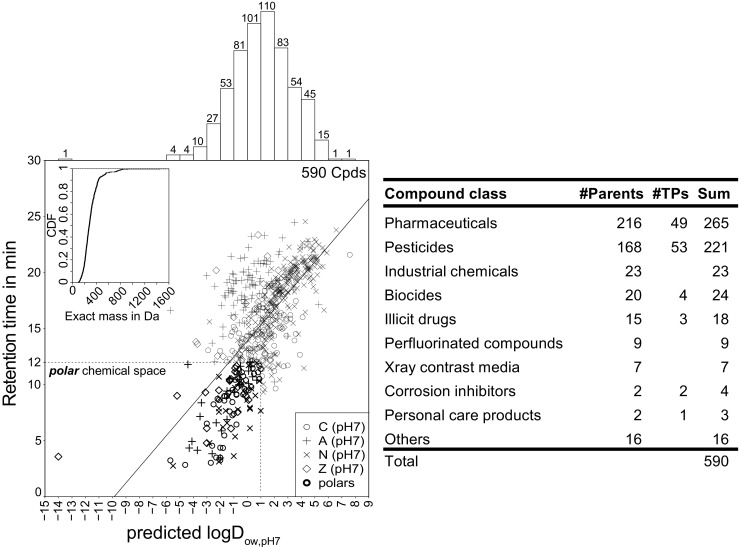
Fig. 1.

Substance selection. Left: chromatographic retention time (RT) versus predicted logD of the 590 organic contaminants selected for method validation. Symbols indicate the predicted major ion species at pH 7 either as cationic (C), anionic (A), neutral (N), or zwitterionic (Z). The polar chemical space includes 118 analytes with a logD ≤ 1 and a RT ≤ 12 min. Exact masses are displayed as cumulative distribution function (CDF) in the top left corner. The logD distribution is shown as histogram in the top left margin. Right: overview of number of parent compounds and transformation products (TPs) in different compound classes. See ESM 2 Table S6 for detailed substance properties
