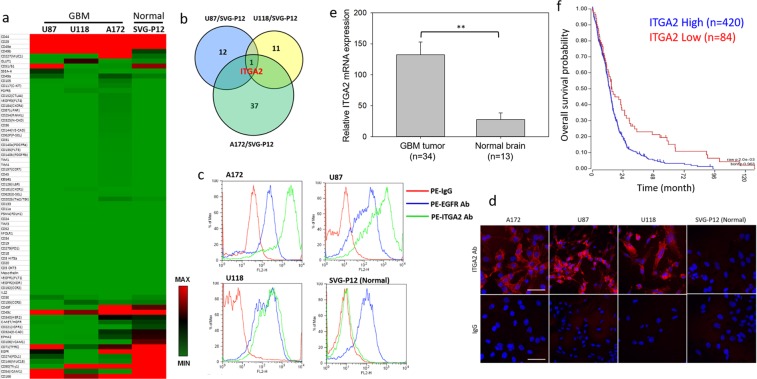
Figure 1.
Identification of ITGA2 as a molecular target for GBM. (a) Surface protein expression profile of 70 cancer-related antigens in three human GBM cell lines and normal SVG-P12 cells. (b) Venn diagram indicating ITGA2 co-overexpressed by three GBM cell lines in reference to SVG-P12 cells. (c) Cell membrane expression levels of ITGA2 and EGFR in GBM and SVG-P12 cells using flow cytometry analysis, showing increased tumor-specificity of ITGA2 expression on GBM cells as compared to both control cells and also to the current GBM marker, EGFR. (d) Representative microscopic images of immunofluorescent staining of ITGA2 in GBM and SVG-P12 cells. Scale bars represent 50 µm. (e) ITGA2 mRNA expression levels in human GBM tumor tissues and normal brain tissues. **P < 0.001. (f) Correlation between overall survival and ITGA2 mRNA expression levels in GBM patients as determined via Kaplan-Meier analysis (Log-rank test). Data of (e) and (f) were obtained from the R2: Genomics Analysis and Visualization Platform database.

