
Fig. 3.
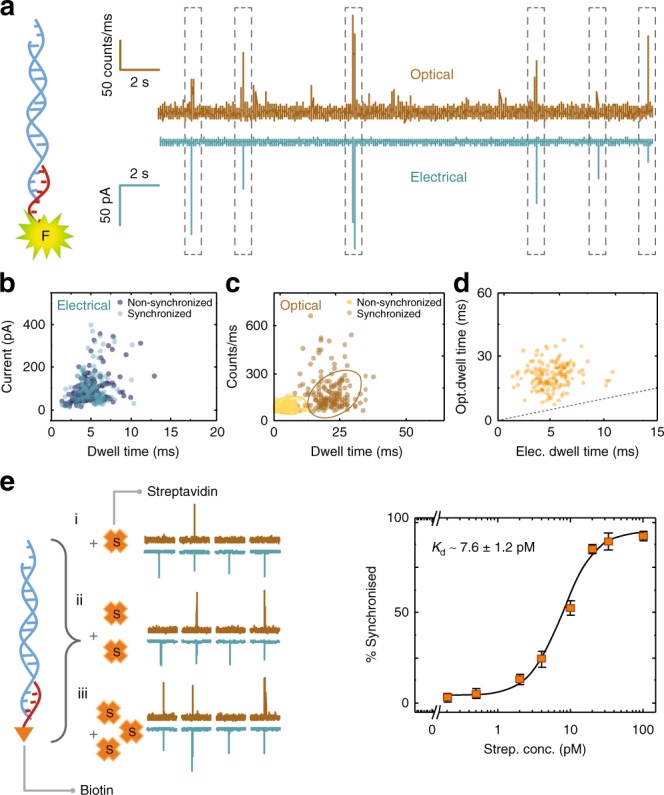
Single-molecule and single-fluorophore sensitivity. a Photon and current time traces for the translocation of λ-DNA carriers bound to fluorescently labelled DNA oligonucleotides (5′-AGGTCGCCGCCC GGTTGGGTGGGTTGG-Atto 488-3′) in 100 mM KCl, buffer (pH = 8). b Scatter plots for dwell time vs. current amplitude/intensity for both electrical and c optical measurements (N = 178 non-synchronised, N = 152 synchronised). Data for both synchronised and non-synchronised events are shown. d Scatter plot showing synchronised optical vs. electrical dwell times. The dashed line has a slope equal to 1 and represents the ideal case of both optical and electrical events having the same dwell times. e A binding assay was demonstrated using a DNA carrier modified with a biotinylated oligonucleotide which can then bind to streptavidin. Translocation experiments were performed at −300 mV bias in 100 mM KCl buffer (pH = 8). A final DNA carrier concentration of 10 pM was used and incubated with Dylight 488-conjugated streptavidin at varying concentrations at room temperature. Error bars indicate the standard deviation for data obtained from three different nanopipettes. In all cases, the laser power was 198 ± 6 μW