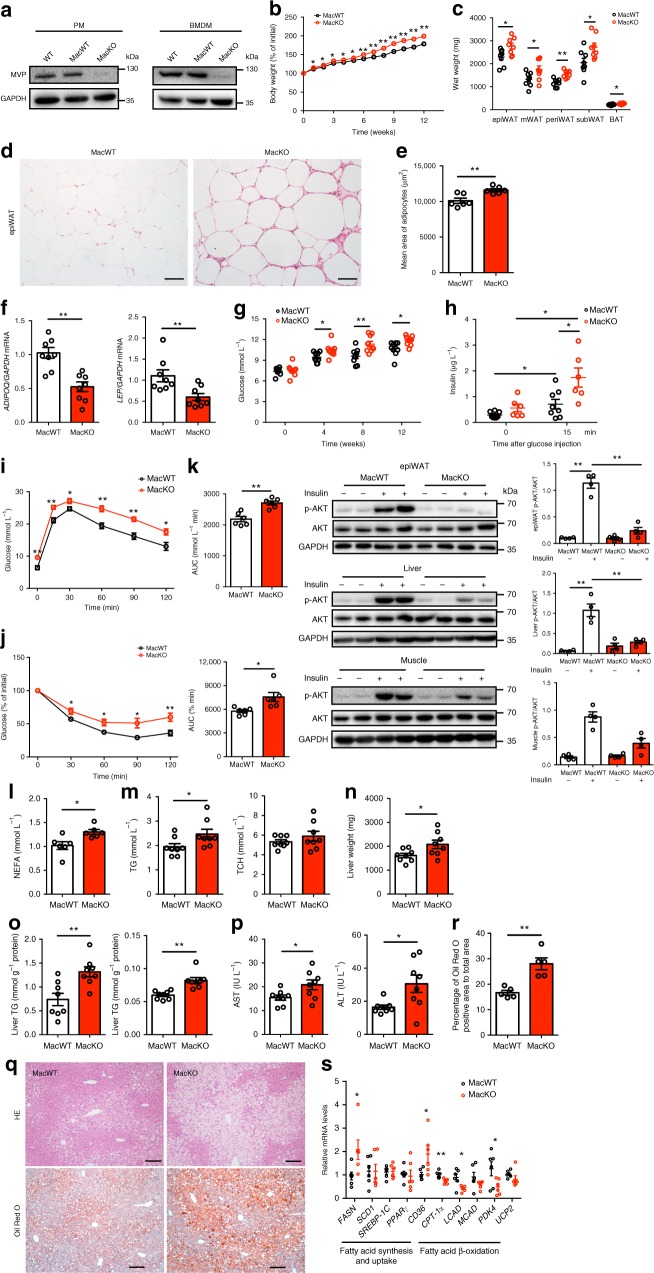
Fig. 3.
Myeloid MVP deletion deteriorates obesity and metabolic disorders. MacWT and MacKO male mice were fed a HFD for 12 weeks. a Western blot analysis of MVP expression in PMs and BMDMs in WT, MacWT, and MacKO mice. b The percentage of body weight gain in MacWT (n = 9) and MacKO (n = 10) mice during 12 weeks of HFD feeding. c Depot mass of epi, m, peri, subWAT, and BAT in MacWT and MacKO mice (n = 8). d Histological analysis of epiWAT from MacWT and MacKO mice using H&E staining. Scale bars, 50 μm. e Quantification of adipocyte size in epiWAT of MacWT and MacKO HFD-fed mice (n = 6). f mRNA levels of ADIPOQ and LEP in epiWAT from MacWT and MacKO HFD-fed mice (n = 8). g Fasting blood glucose in MacWT and MacKO mice (n = 9). h Basal- and stimulated- insulin levels in MacWT (n = 8) and MacKO (n = 6) mice. i, j GTT and ITT in MacWT and MacKO mice (n = 6). k Western blot analysis of AKT phosphorylation in the murine epiWAT, liver, and skeletal muscle after insulin administration in vivo. l, m The NEFA (l) (n = 6), TG and TCH (m) (n = 8) contents in the plasma of MacWT and MacKO mice. n, o Murine liver tissues were retrieved and their wet weight (n), liver TG and TCH contents (o) were determined (n = 8). p Plasma levels of AST and ALT in MacWT and MacKO mice (n = 8). q H&E (top) and Oil Red O (bottom) staining of representative liver sections obtained from HFD-fed MacWT (left) and MacKO (right) mice. Scale bars, 100 μm. r Quantification of Oil Red O stained area of liver (n = 5). s mRNA levels of lipid metabolism-related genes in livers from the HFD-fed MacWT and MacKO mice (n = 6). Data are expressed as mean ± SEM. *P < 0.05 and **P < 0.01 by Student’s t test or ANOVA with post hoc test

