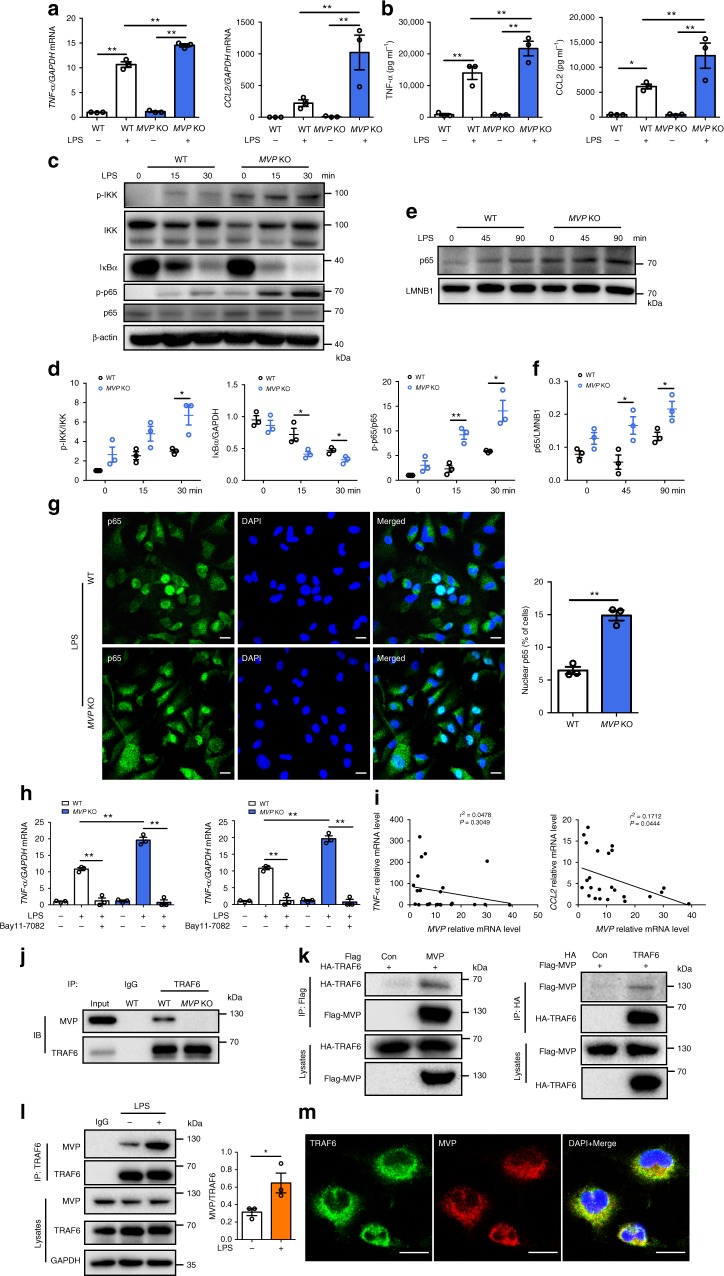
Fig. 6.
MVP deficiency activates IKK–NF-κB signaling. PMs isolated from CD-fed WT and MVP KO mice were treated with LPS (100 ng ml−1) for indicated times. a, b PMs were stimulated with LPS for 12 h and mRNA levels of inflammatory mediators (TNF-α and CCL2) were assessed by RT-qPCR (n = 3) (a). TNF-α and CCL2 levels in culture media were determined using ELISA (n = 3) (b). c, d Western blot analysis of p-IKK, IKK, IκBα, p-p65, and p65 in PMs that were treated with LPS for indicated times (n = 3). e, f Western blot analysis of nuclear extracts prepared from PMs stimulated with LPS for the indicated times and analyzed for p65 and Lamin B1 (n = 3). g Representative immunofluorescence images of p65 nuclear translocation assay. PMs were stimulated with LPS for 3 h and analyzed for p65 localization by immunofluorescence staining. Nuclei were stained with DAPI, and the percentage of nuclear p65 positive cells was counted. Scale bars, 10 μm. h mRNA levels of inflammatory mediators in PMs cultured with or without LPS or NF-κB pathway inhibitor BAY11-7082 (n = 3). i Correlative analysis of the expression of MVP versus TNF-α and CCL2 in CD14+ macrophages from the visceral adipose tissue of overweight/obese human subjects (n = 24). j Co-IP and western blot analysis of endogenous MVP and TRAF6 from protein lysates of murine BMDMs. k HEK293T cells were transfected with control Flag empty vector or Flag-MVP and HA-TRAF6 plasmids (left), and control HA empty vector or HA-TRAF6 and Flag-MVP plasmids (right). Co-IP and western blot analysis with anti-HA and anti-Flag antibodies. l Co-IP and quantification of the interaction between MVP and TRAF6 in response to LPS stimulation in BMDMs. m Representative immunofluorescence images of PMs stained by anti-MVP (red) and anti-TRAF6 (green) antibodies to examine the distribution of MVP and TRAF6. Scale bars, 10 μm. Representative results from three independent experiments are shown. Data are expressed as mean ± SEM. *P < 0.05 and **P < 0.01 by Student’s t test or ANOVA with post hoc test

